Problems with NNT

In talking to a patient or in making grand policy decisions, when the likely benefit of a treatment is being considered, it is wise to utilize both relative (e.g., hazard ratio) and absolute treatment effects. For the latter, two classes of effects are the life expectancy scale and absolute risk reduction (ARR). Many clinicians are taught to translate ARR to the number needed to treat to save one life or prevent one clinical event — the NNT. There are many reasons that I dislike the NNT. I thought I would take this opportunity to describe some of them. The first problem stems from trying to replace two numbers with one, i.e., instead of reporting the estimated outcome with treatment A and the estimated outcome with treatment B, the physician just reports the difference between the two.

Loses Frame of Reference: Suppose that the quantity of interest is the estimated risk of a stroke by 5y, and the estimated risks under treatments A and B are 0.02 and 0.01. Then ARR=0.01 and NNT=100. But if the two risks are 0.93 and 0.92 the ARR and NNT remain unchanged. Yet the patient will likely perceive the two settings to be quite different for the purpose of their decision making.

Computing NNT from Group Data and Using it on an Individual: The vast majority of NNTs are computed using group averages. For example, a physician may read a clinical trial report that provides the overall unadjusted cumulative incidence of stroke at 5y to be 0.25 and 0.20 for treatments A, B and compute NNT=1/(0.25 - 0.2) = 20. What is the interpretation of 20? It really has no interpretation. That is because RCTs with even the most restrictive inclusion criteria have a variety of subjects with much differing risks of the outcome. ARR varies strongly with baseline risk as discussed in more detail here. Thus ARR is subject-specific and so is NNT. NNT is impossible to be a constant, and if it is computed as if it were a constant, it may not apply to any real subject.

NNT Invites Physicians to Make Group Decisions: NNT as almost always computed on groups and thus apply to some sort of ‘average person’ who may not exist. An NNT of 50 is interpreted by many physicians as “I need to treat 50 patients to save one”. Who are the 50? Who is the one? Decision making in medicine is one patient at a time, and needs to use that patient’s absolute risk or life expectancy estimates.

NNT Has Great Uncertainty: How often have you seen a confidence interval for NNT? Probably not very often. And when you compute them they are often so wide as to render the NNT point estimate meaningless, even if the problems listed above didn’t bother you. For example, an ARR that comes from the two proportions 1/100 and 2/100 is 0.01 with 0.95 confidence interval of about [0, 0.044]. Confidence limits for NNT are the reciprocals of these two numbers or [23, ∞].

Recommendations: Instead of NNT, report patient-specific estimates of absolute outcome risks under treatments A and B, or two life expectancies.
18 Likes

Is there no use for NNT, even for population based decisions?

1 Like

Along the same lines. I agree with the issues of widening confidence intervals and poor interpretability of an NNT. But clinicians, policy makers, and guideline writers tend to think about the statistic when developing population-based recommendations or as part of a cost-effective analysis. How do you feel it misleads in those settings - other than widened confidence interval and not including patient specific risks.

To me, I wouldn’t recommend NNT even for population decisions, but you could get lucky that the average ARR gives you a correct ‘population decision’ (whatever that means) when compared to the more time-consuming examination of risk distributions. And by the time you’ve done the time-consuming analysis to check, you might as well use it anyway.

Other than quaranteens and closing borders when epidemics occur, I can’t think of many population decisions in medicine.

3 Likes

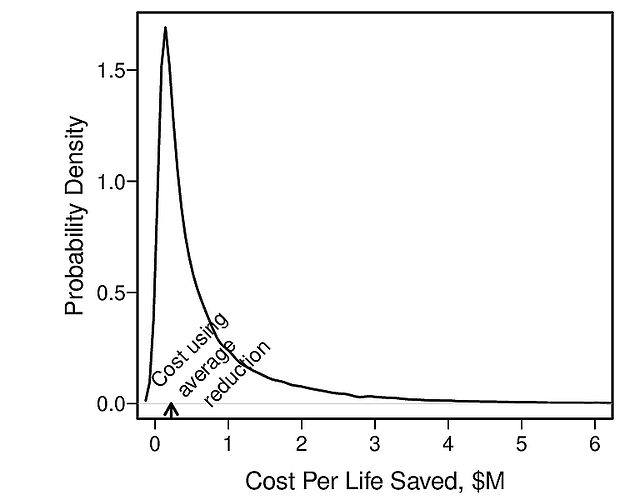
Concerning cost-effectiveness analysis, when presented as a cost-effectiveness ratio (CER), that is the ratio of absolute effectiveness to absolute cost increment. Absolute effectiveness is either an absolute risk reduction or life expectancy gain. Either of those two measures vary drastically by patient risk factors and severity of disease. So CER must be patient-specific, and the usually attempt to take the ratio of two averages may not apply to any patient in the study. It’s another example where group decision thinking gets in the way of individual patient decision making. Rational clinical practice would use a treatment in individual patients where the CER is low. For an example individual-patient CER analysis see the GUSTO-I example in the BBR ANCOVA chapter. Figure 13.8 from that chapter is below.

NNT makes sense to me for setting general guidelines. I think it would be great if we lived in a world where people would calculate the individual risk of a patient, but not everyone will do that. Despite its problems, having a default decision that is good on average is better than having one that is bad on average, right?

Regarding CIs, “about zero” and “zero” are not the same thing - reporting an upper limit of infinity seems wrong. I’m glad that the confidence interval turns out to be wide in the scenario you proposed (total sample size of 200, 3 events observed)… if the estimate is not precise enough for decision making, all that is required is a larger sample?

I can’t agree. The default decision could very well not apply to any patient. Physicians who stay away from individual risks are IMHO at risk in the long-term, e.g., AI can beat them at decision making for their patient.

Three is absolutely nothing wrong with reporting an upper limit of infinity. But if I had taken time to compute a more exact interval it would have been still huge, e.g., 1000. A huge upper confidence limit is properly interpreted as “we don’t know much.” Had n=1000 per group the lower CL would be about 50 but the upper confidence interval still is effectively infinite. NNT, even in the rare case where averages are meaningful, are unstable.

1 Like

the explicit motivation for using nnt is that “commonly used effect sizes are limited in conveying clinical significance.” [ref1] I’m quite ambivalent about this. The appeal to clinical relevance can certainly perpetuate bad habits. (You used to hear people promote LOCF because, they claimed, it was simple enough for clinicians to understand. With this reasoning you can justify all kinds of bad analyses, including nnt.) On the other hand, i don’t mind being a pragmatic - I advocated for the use of the probability index which is related to nnt (senn argued strongly against the PI – see his response to acion’s stats in med paper 2006). But the results of phase II trials that employed a composite endpoint as the primary outcome were reported without an estimate of the effect size (because they tend to yield ranks or z-scores [ref2]). I’m not particularly fond of composites, but until clinicians are willing to discard them, we need some solution, the prob index is a stop gap… practical considerations taint the stats. It’s like all this p-value bashing; if we discard p-values they will only be replaced by something that poses all the same problems (data dredging, p-value hacking etc etc) because of the reality of decision-making and extraneous influences and communicating and making use of research results. Actually this compromise between statistical considerations and ‘clinically meaningful’ results exists within the literature on composites endpoints itself - some composites are fixated on maximising statistical power and others are concerned only with constructing a clinically relevant measure, and it seems these are not harmonious goals, you end up achieving one or the other and the researcher is compelled to reveal what matters most to them

3 Likes

I agree with your stated issues with NNT, and would add my own:
First, NNTs are generally poor choices for shared decision-making discussions with patients. Numeracy is incredibly variable and people tend to struggle with fractions, which means that most people will not truly understand the magnitude of effect if you tell them something along the lines of “about 1 in 81 people will benefit from being treated with X instead of Y.” This is further compounded when you start talking about several outcomes, especially when trying to contrast benefits and harms “About 1 in 81 people will benefit from taking X, but an extra 1 in 23 will be harmed”. People are much more likely to understand risks communicated using common denominators of 100 or 1000.

To expand on your first point about losing frame of reference, NNTs are often quoted in a way that omits key information, most commonly timing and, sadly, the outcomes themselves. For instance, I have heard colleagues make statements along the lines of “aspirin isn’t very effective after an MI, its NNT is around 40,” forgetting that this NNT referred to a mortality reduction from only 1 month of therapy in the ISIS-2 trial. A more recent example involved disparaging the results of the SPRINT trial based on the fact that the NNH for hypotension of ~72 was close to the NNT for the primary efficacy outcome (including things like death, heart failure, stroke and MI) of ~63. Hypotension can be serious; however, few of these episodes are as severe as most efficacy outcomes measured in SPRINT.

I think that widespread teaching of NNTs has resulted in more clinicians and policymakers focusing on absolute rather than relative risk differences, which is positive. However, I would like to see this evolve to using more of the available information from absolute event rates, and use of both absolute and relative risk differences.

3 Likes

Nicely stated. This makes me think that we need to train everyone to embrace probability. Just as gamblers become expert in probability because they win more, anyone can learn about odds and risk. I think to some degree NNT is a desire to get a whole number replacement for probabilities. We need decision makers (both MDs and patients) comfortable with the idea that risk applies to individuals.

2 Likes

Couldn’t say it better.

I wonder what everyone here thinks of attempts to come at this issue from an MCDA lense. I’m currently working on a paper with a colleague to take the relative effects of a trial/meta-analysis (with uncertainty) combined with an assumed baseline risk to generate absolute probabilities. These are then weighted by importance to create a loss function which is used to rank treatments.

We’re planning to package the whole thing into a little shiny app or something similar. It’s essentially a simplified version of the approach proposed here: https://www.researchgate.net/publication/51923322_Multicriteria_benefit-risk_assessment_using_network_meta-analysis

Lots of issues/assumptions (e.g. joint distribution of outcomes is product of marginals), but I wonder if it might provide a bridge to make it easier to a) work directly with probabilities, and b) frame outcomes in terms of how much they matter to individual patients/clinicians/guideline groups.

The math for a single outcome fis pretty easy and is detailed on some of my blog posts and in BBR. But I don’t think it’s up to any of us to define the loss function to optimize. This should be up to the patient in consultation with the physician, often on a case-by-case basis. At some point we need a new topic to discuss simultaneous consideration of multiple outcomes - a very important topic - thanks for mentioning it. We also need topics to discuss patient utility elicitation and analysis.

1 Like

Given that as a patient I care more about how long I have good health for, then what age I live to, many of these endpoints are not that meaningful to me.

NNT also does not take into account people being sensible and stopping taking tablets when they feel they are getting no benefits from them, unlike clinical trials where everyone keeps taking the tablets because they’re paid to do so…

1 Like

Dear Friends, I have recently been reviewing the trials (with use of antidiabetic) that evaluated end-points cardiovascular events. Among the 19 trials are very divergent nnt when considering the time of treatment in which the benefit occurred. Is there any method that allows us to adjust the NNT / Time of treatment, so that they are comparable? Is there any advantage in calculating nnt / nnh?

2 Likes

i would definitely consider an alternative estimate. maybe consider steve nissen’s famous meta-analysis of cv events for avandia?: https://www.nejm.org/doi/full/10.1056/nejmoa072761

edit: regarding adjustment for time on treatment, maybe this other post is relevant: Is it reasonable to adjust for a post-baseline covariate?

One of the key problems with NNT is that it does not transport to other patient populations and there is no way to adjust it. That’s because we are trying to think of it as a number when in fact it is a function of all the patient characteristics that modify absolute risk. Showing the entire absolute risk function, or absolute risk reduction function, as I did in one of the referenced blog articles, is to me the way to go.

2 Likes

There is another problem with the NNT. It is the reciprocal of the risk difference RD defined as the difference between two proportions. Both obviously should be reported with confidence limits. In the non-significant case, the CLs for the NNT are absurd. Suppose we wish to compare the success rates on two treatments, 47 out of 94 (50%) and 30 out of 75 (40%). The estimated difference here is +0.1000. The 95% Wald interval is -0.0500 to +0.2500. Naively inverting these figures results in an NNT of +10, with 95% interval -20 to +4.

Note here that the calculated interval actually excludes the point estimate, +10. Conversely, it includes impossible values between -1 and +1, including zero. The explanation is that the calculated limits, -20 and +4, are correct. But the interval that these limits encompass must not be regarded as a confidence interval for the NNT. In fact, it comprises NNT values that are NOT consistent with the observed data. The correct confidence region is not a finite interval, but consists of two separate intervals extending to infinity, namely from -infinity to -20 and from +4 to +infinity. In Buzz Lightyear’s immortal words - To infinity and beyond! While a confidence region of this nature is perfectly comprehensible to a mathematician, one would not expect clinicians to be comfortable with it as an expression of sampling uncertainty.

5 Likes

I’ve not seen that angle discussed before. Very interesting. Would be useful to repeat with better (and properly asymmetric) Wilson confidence intervals.

You know, such good ideas come out of these discussions that maybe people should collaborate around them and produce publications. How unique would that be for an online community!

2 Likes