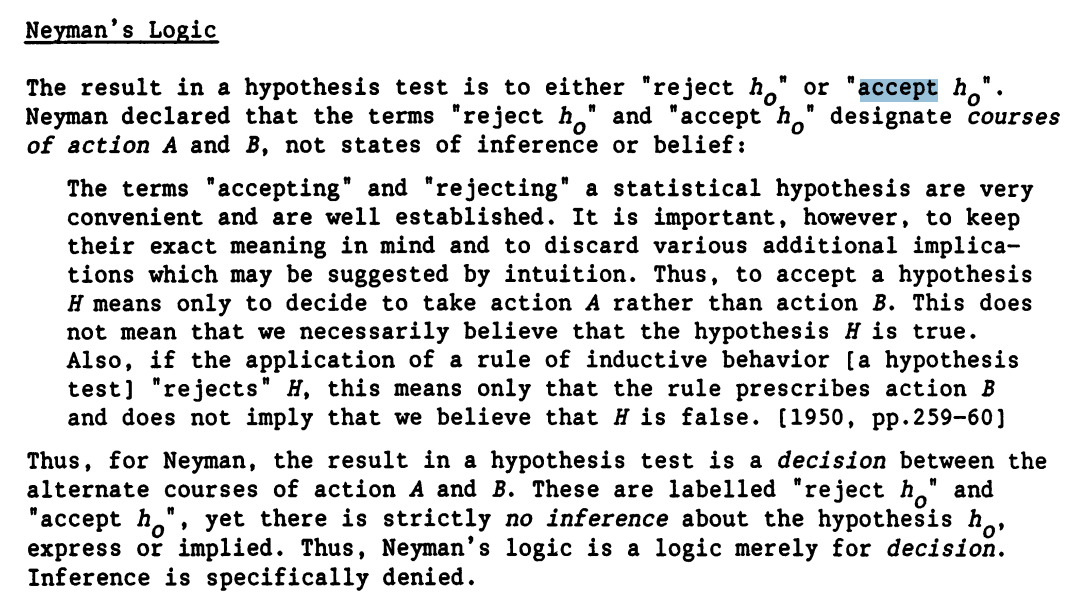
Throughout the scientific literature, there are several examples of authors and editors interpreting nonsignificant results ( p > 0.05 ) as being evidence for the null hypothesis. This contrasts with the characteristics of frequentist hypothesis testing, where the test hypothesis (such as a null hypothesis) can only be rejected, but never accepted.
“By increasing the size of the experiment, we can render it more sensitive, meaning by this that it will allow of the detection of a lower degree of sensory discrimination… Since in every case the experiment is capable of disproving, but never of proving this hypothesis, we may say that the value of the experiment is increased whenever it permits the null hypothesis to be more readily disproved.” - Fisher, The Design of Experiments
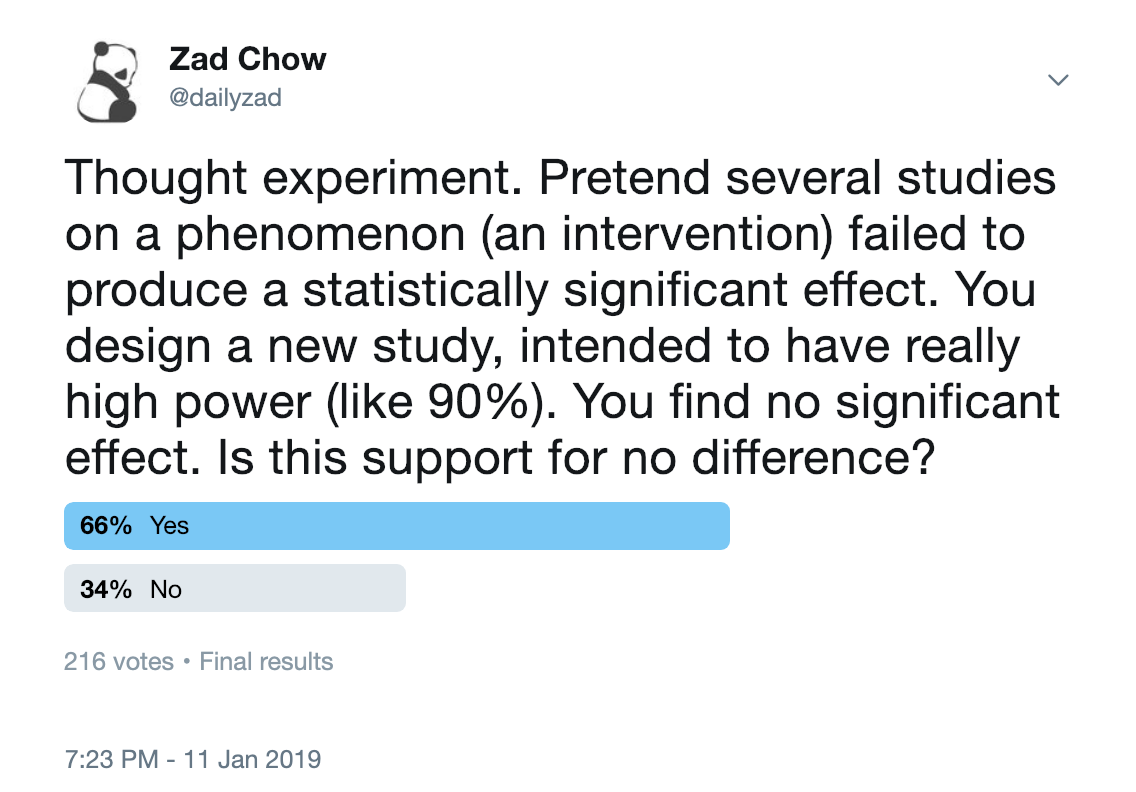
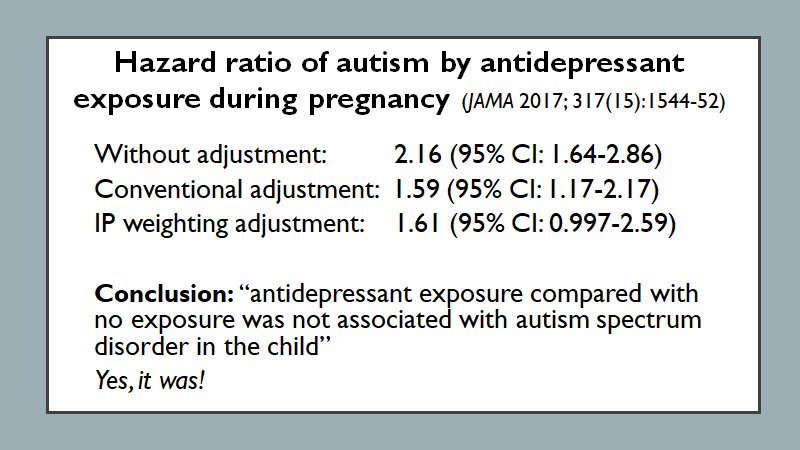
Failure to reject the null hypothesis becomes proof for the null rather than a true suspension of judgement and can be seen with several examples such as the following:
Such misinterpretations also have a trickle down effect where they affect people who do not understand what concepts like statistical significance are. This includes policy makers, influential bloggers, and others. Take this example from a highly popular blog, Science-Based Medicine, interpreting the results of an observational study on EMFs and brain tumor risk. SBM writes,
"Overall, around 10% of study participants were exposed to RF while only 1% were exposed to IF-EMF. There was no clear evidence for a positive association between RF or IF-EMF and the brain tumors studied, with most results showing either no association or odds ratios (ORs) below 1.0. The largest adjusted ORs were obtained for cumulative exposure to RF magnetic fields (as A/m-years) in the highest exposed category (≥90th percentile) for the most recent exposure time window (1–4 years before the diagnosis or reference date) for both glioma, OR = 1.62 (95% confidence interval (CI): 0.86, 3.01) and meningioma (OR = 1.52, 95% CI: 0.65, 3.55).
Essentially, this is a negative study. The possible correlation between the highest and most recent exposure with brain tumors was not statistically significant. The authors conclude that this possible association deserves further research, which is what authors always say, but this needs to be put into context.
When looking for so many possible correlations, there is going to be a lot of statistical noise. In this study, some of the groups had risks less than one, which if taken literally means that the EMF had a protective effect. No one would conclude this, however. This is just the random noise in the data. Even statistical significance does not necessarily mean an effect is real, but it is a minimum threshold for the data being interesting. In these kinds of studies, and generally, a non-statistical trend should just be treated as negative."
While we lack any serious data, one could argue for the potential of such misinterpretations having catastrophic effects on health policy and public education.
Hoping that a discussion of this topic here can foster recommendations on how to address such problems in the literature, how to word corrections, and how to induce systematic changes for these widespread misinterpretations.
Initial Edits: Just some grammatical errors and formatting.