Greetings All, I am seeking help with proper interpretation of a proportional odds model I am using (for learning purposes). The outcome of interest is the modified rankin scale (mRS) at 90-days after stroke with values ranging from 0-6. My predictors include the mRS score at 30-days (same 0-6 scale), age, and prior stroke. Using the rms package, my model is as follows:
model = lrm(MRS90D ~ MRS30D * rcs(AGE,4) + PMH_STROKE, data=data, x = TRUE, y = TRUE)

The output (summary(model)) is as follows:
             Effects              Response : MRS90D

 Factor      Low High Diff. Effect   S.E.    Lower 0.95 Upper 0.95
 MRS30D       2   4    2     3.90390 0.18678  3.537800   4.27000
  Odds Ratio  2   4    2    49.59600      NA 34.392000  71.52000
 AGE         52  70   18     0.49424 0.21579  0.071296   0.91717
  Odds Ratio 52  70   18     1.63920      NA  1.073900   2.50220
 PMH_STROKE   0   1    1     0.28317 0.18362 -0.076709   0.64305
  Odds Ratio  0   1    1     1.32730      NA  0.926160   1.90230

Adjusted to: MRS30D=4 AGE=62
I would sincerely appreciate help in the proper interpretation of the odds ratio, particularly for the MRS30D variable. How would this be stated and explained to others (e.g. in a paper or to a clinical collaborator).
Thank you all in advance.
Bill
2 Likes
Great question.
My interpretation: an increase from to 2 to 4 in the mRS30D is associated in a - here, gigantic - 49-fold increase in the odds of a higher mRS90D. Given our proportional odds assumption, this holds true for any threshold of the Rankin scale ie, odds of mRS90D >=1, odds of mRD90D >=2, etc.
I would love to hear from @f2harrell and others what would be the clearest and most precise way of reporting/communicating ORs from a proportional odds logistic regression model.
4 Likes
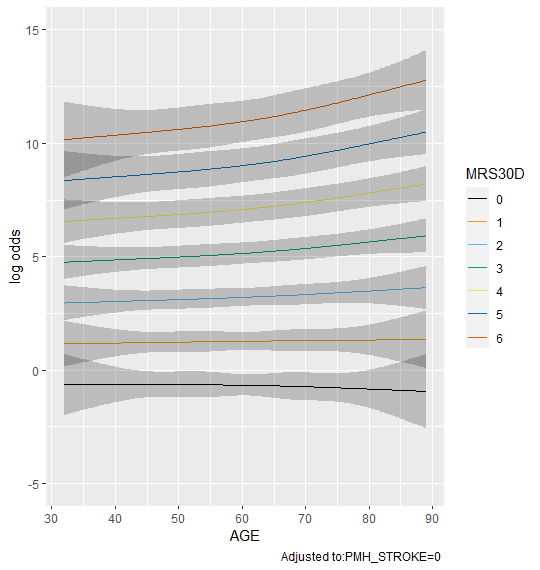
That’s it. I would just add that the reliability of that estimate depends on three sample sizes: the number of patients near age 62 and the number with mRS30D near 2 and near 4. Since age interacts with the variable in question, the odds ratio is for the reference age of 62 (the sample median). You can easily alter the reference age using age=50 for example inside summary(). For such a huge OR there is probably a small cell size somewhere so I’m tempted to recommend not reporting the OR and just reporting its uncertainty interval. It would also be good to show a fuller picture using a partial effect plot. You could vary age on the x-axis and have different curves, e.g., ggplot(Predict(fit, age, mRS30D)).
1 Like
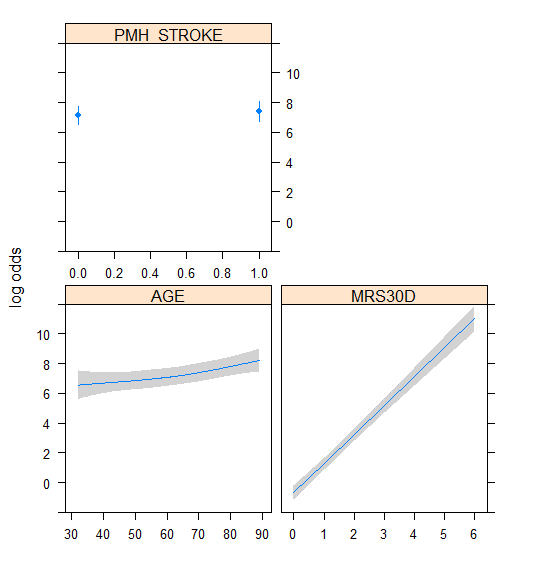
Thanks to both of you. Here are the partial effect plots for all 3 predictor variables as well as for age alone (as @f2harrell recommended).
4 Likes
Thanks Frank! I agree with his point and meant to mention that such a large OR might be implausible.
It might be worth converting the logodds to probabilities eg, by setting the fun argument to probit in rms::Predict(). The kint argument in the same function allows you to specify the intercept and will allow you to display P(Y>=j).
3 Likes
Thank you again. Am I correct in that the RMS package does not allow for partial proportional odds to be modeled for certain variables?
For frequentist models use the vglm function in the VGAM package to run partial proportional odds models. For Bayesian partial PO models, especially constrained partial PO models, you can use the rmsb package blrm function. For vglm you can get parameter structure closer to what rms uses by specifying e.g.
f <- vglm(y ~ x1 + x2, cumulative(parallel=FALSE ~ x2, reverse=TRUE), data=...)
The notation above means to relax the PO assumption for x2.
1 Like
Yes, I have gotten that to work with the VGAM package. I have also been playing with the rmsb package. I used the following code (assuming flat priors) to run a partial PO model. When I ask for the summary of the model [summary(model_bayes_ppo) I get the subsequent error asking for a single value of ycut. From the package instructions, I cannot decipher what information it is asking for.
model_bayes_ppo = blrm(MRS90D ~ MRS30D * rcs(AGE,4) + PMH_STROKE, ppo=~PMH_STROKE, data=data, file=‘model_bayes_ppo.rds’)
Error in summary.rms(model_bayes_ppo) : must specify a single value of ycut for partial prop. odds model
With a partial PO model the OR for a “relaxed” variable depends on the Y cut. For a numeric Y=0,1,2 variable you can specify ycut=2, for example. For character string levels of Y use e.g. ycut='death'.
1 Like
Is there an output either from the RMS or RMSB packages that gives me predicted values for a ‘y’ ordinal outcome holding other variables constant? I cannot seem to find that in the package literature.
Start with the RMS Course Notes chapter on ordinal models for continuous Y. Then look at the vignette for the rmsb package. You’ll see for both frequentist and Bayesian models there are functions like exProb, Quantile, and Mean that will compose R functions to convert log odds to various parameters.

