I always thought that RTM was addressed by study design (RCTs) rather than statistical modeling. However this post from Solomon made me wonder about this. Is it possible to say which is more influential here (design or statistic/covariate)?
I also presume that the answer may vary depending on eligibility criteria (thresholds for inclusion) and that would be why Harrel states that RMANOVA should not be used in such cases. I also presume it would be extended to ANOVA of delta changes.
Keep in mind that the broader context for these discussions is the situation where there are large chance imbalances between the groups in the outcome measured at baseline. When that happens, the estimated treatment effect you get from your particular dataset will be misleading unless you adjust for baseline outcome. There is a mistaken belief that analyzing change scores will “account” for baseline differences in some way similar to ANCOVA-style adjustment. The point being made in Solomon’s post and the linked references is that no, change scores do not account for baseline differences in the same way that adjusting for baseline does.
On that note, in a scenario where there is one baseline and one follow-up measurements, would it be inherently wrong to analyze RMANOVA also with baseline covariate or change scores with baseline covariate?
Note that my question is not if those would be ideal, but rather if they are ok.
What do you mean by RMANOVA? Repeated measures ANOVA? With only one follow-up measurement you don’t really have repeated measures.
Edit: if you mean treat the baseline measurement as an outcome too and look at the time x treatment term, I don’t see how you’d do that while also including the baseline as a covariate.
This paper from almost 50 years ago, though itself partly obsolete, shows that (some) psychometricians were questioning RMANOVA for this design much longer ago.
Citation
Huck, S. W., & McLean, R. A. (1975). Using a repeated measures ANOVA to analyze the data from a pretest-posttest design: A potentially confusing task. Psychological Bulletin, 82(4), 511–518. https://doi.org/10.1037/h0076767
Abstract
The pretest-posttest control group design (or an extension of it) is a highly prestigious experimental design. A popular analytic strategy involves subjecting the data provided by this design to a repeated measures analysis of variance (ANOVA). Unfortunately, the statistical results yielded by this type of analysis can easily be misinterpreted, since the score model underlying the analysis is not correct. Examples from recently published articles are used to demonstrate that this statistical procedure has led to (a) incorrect statements regarding treatment effects, (b) completely redundant reanalyses of the same data, and (c) problems with respect to post hoc investigations. 2 alternative strategies-gain scores and covariance-are discussed and compared.
I remember reading that article in peak quarantine (2020) and getting crazy for it having more than 40 years, but looking like it was talking directly to me and explaining several of doubts that I had.
Dear Professor @f2harrell,
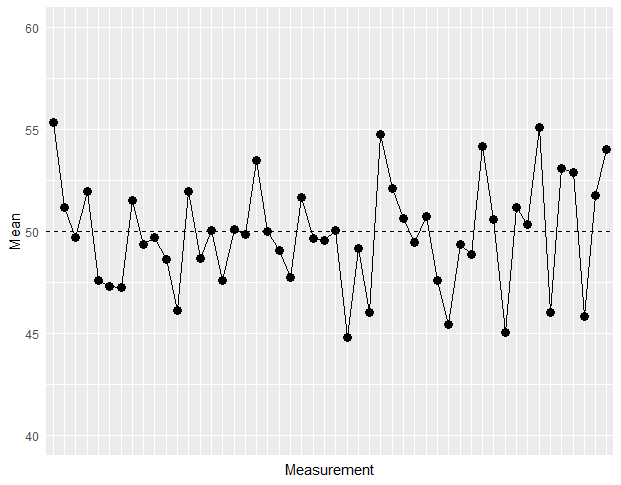
I’ve been trying to come up with some demonstration of the regression to the mean phenomenon.
This is my code (the plot is attached):
There are two ways: this and simulating a selection problem, e.g., simulate baseline and follow-up (correlated with baseline) measurements for 100 subjects. Take the 30 subjects with the lowest baseline values. For the same subjects compute their mean follow-up value and compare them to the true means.
Dear Professor @f2harrell, thank you for your suggestions.
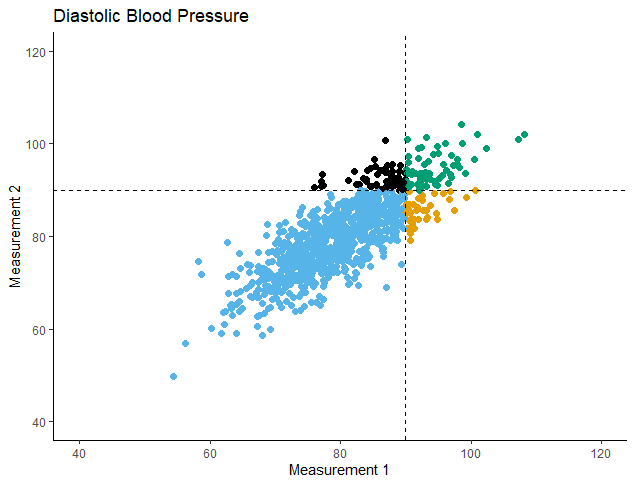
I went for the second way:
I simulated 2 diastolic blood pressure (dbp) measurements for 1000 subjects.
Mean dbp at Measurement 1 = 80
Correlation between Measurements 1 and 2 = 0.8
Then I compared the 2 Means with a paired t-test:
t = -0.48933, df = 999, p-value = 0.6247 alternative hypothesis: true mean difference is not equal to 0 95 percent confidence interval: -0.3877248 0.2329537 sample estimates: mean difference -0.07738556
And then I selected those subjects with dbp > 90 at Measurement 1 (N=100) and compared their 2 Means:
t = 4.8716, df = 99, p-value = 4.207e-06 alternative hypothesis: true mean difference is not equal to 0 95 percent confidence interval: 1.408993 3.345554 sample estimates: mean difference 2.377274