Clinician-scientists involved in clinical trials who have inadequate statistical input often design clinical studies to use a binary responder analysis. They seem to believe that because a binary treatment decision is required (it’s not), the outcome should be binary (it doesn’t). Decisions can be deferred, doses changed, a treatment can be launched on a trial basis, etc., and blood pressure trials work quite well in mmHg rather than using the proportion of patients who achieved a certain blood pressure threshold.
Responder analysis is a 4-fold loser. It fails to give the needed clinical interpretation, has poor statistical properties, increases the cost of studies because binary outcomes require significantly higher sample sizes, and raises ethical issues because more patients are required to be randomized than would be needed were the endpoint and analysis to be fully efficient.
First consider the best (though still not good) case for dichotomizing a continuous or ordinal outcome. Suppose that an ordinal scale with 8 levels, scored 1-8, and that there was a clinically well accepted break between levels 2 and 3 so that patients having a score of 1 or 2 were clearly in remission of their disease and those at levels 3-8 were not in remission. Dichotomizing the scale as 3-8 vs. 1-2 could be used to estimate the proportion in remission. But if patients in level 1 are better off than those at level 2, or those at level 8 were worse off than those at level 3, there is a distinct loss of clinical information. The dichotomizing clinician-scientist asked the question “what’s the chance of achieving remission” but forgot to ask “how far out of remission were the patients?”.
As an example, a recent JAMA article by Costello et al contains the following description of the primary study input in this ulcerative colitis trial:
The primary outcome was steroid-free remission of UC, defined as a total Mayo score of ≤2 with an endoscopic Mayo score of 1 or less at week 8. Total Mayo score ranges from 0 to 12 (0 = no disease and 12 = most severe disease).
Dealing with the clinical interpretation of the trial, would clinical investigators not want to know by how many levels the ordinal scale was typically improved by the new treatment? And now there is a new problem—a perceived issue with clinical interpretation of an ordinal scale has been replaced by a different interpretation problem. Suppose that 3/10ths of patients responded to placebo and 4/10ths responded to a new drug. Is the population difference between 0.3 and 0.4 clinically significant for an individual patient? Wouldn’t the amount of disability, pain, quality of life, exercise time, etc. that the drug improved be of more interest and actually be easier to interpret regarding patient benefit?
Consider a different example where the original outcome scale was carefully derived after choosing a series of 20 appropriate questions about symptoms and function, scoring each from 0-4, and using appropriate weights to create a 0-80 scale. Such a scale can have rich statistical information, maximizing power. But if a clinician-scientist dichotomized the scale, she is saying in effect that “This scale stinks. I don’t trust it.” Why go to all the trouble to ask 20 questions and create and validate the scoring system only to do this?
Section 18.3.4 of BBR details the statistical power loss from dichotomizing a continuous or ordinal outcome. A key paper referenced there is Fedorov, Mannino, and Zhang who showed that if you dichotomize a continuous variable at the optimum point (the true population median), the needed sample size for the study might be 158 patients for the dichotomized endpoint but only 100 for the original continuous variable. And that is the best case for dichotomization. Were the scale dichotomized at 2 standard deviations above the true mean, the sample size would need to be increased by a factor greater than 5!
What is even worse than simply dichotomizing an ordinal or continuous scale? Using change from baseline and/or combining absolute change with relative change and not understanding the math. The BBR section referenced above includes a classic example from Stephen Senn reproduced below.
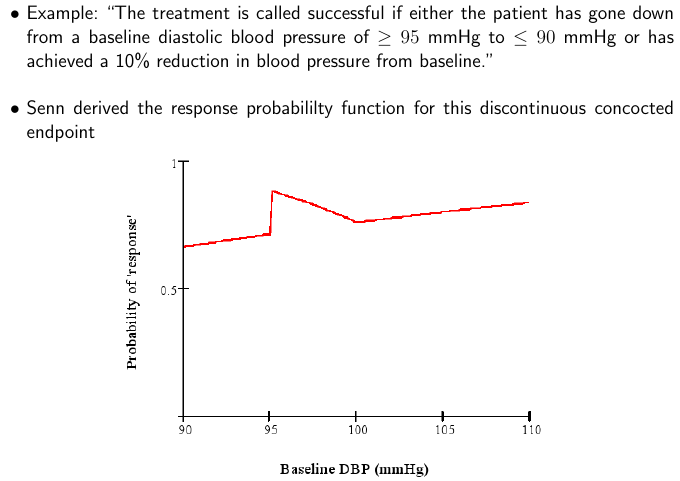
By analyzing the situation and plotting the probability of response as a function of the baseline value, one can see that what makes a patient a “responder” is as much the patient himself, not the treatment. Clinicians and clinician-scientists can avoid much of this problem by remembering the simple fact that what matters most to the patient, and what is easiest to model statistically, is the post-treatment status. Baselines should be accounted for (to increase power) using covariate adjustment.
A more recent example of this latter sort of dichotomania combined with contortion is the paper by Rutgeerts et al which uses this primary outcome variable:
A response was defined as a decrease in the Mayo score of at least 3 points and at least 30 percent, with an accompanying decrease in the subscore for rectal bleeding of at least 1 point or an absolute rectal-bleeding subscore of 0 or 1.
It is true that special considerations are needed for endpoints that combine multiple components, and this can probably be done with an ordinal scale. But note that it is very difficult to equate a certain change in one variable with a certain change in another variable. it is far more justifiable to combine absolutes and covariate adjust for baseline values. The bad math identified by Senn is in place in this NEJM article also, and the Mayo score is not one that works by percent change.
As discussed above, dichotomization to create a “responder” has profound sample size implications. This means that the study budget must be increased to pay for the “dumbing down” of the endpoint. That’s where the ethical problem comes in. Section 18.7 of BBR is a detailed case study of a treatment for Crohn’s disease that used the Crohn’s disease activity index (CDAI). In the case study I reanalyzed the data in the original CDAI article and demonstrated that there is no possible cutoff in CDAI, and were a cutoff to exist, it would certainly not be the one used in the clinical trial being discussed (150). See the graph below.

We convened an ethics-biostatistics clinic in which three of our esteemed biomedical ethicists participated. These ethicists concluded that the proposed new trial was not ethical, for these reasons.
- Patients are not consenting to be put at risk for a trial that doesn’t yield valid results.
- A rigorous scientific approach is necessary in order to allow enrollment of individuals as subjects in research.
- Investigators are obligated to reduce the number of subjects exposed to harm and the amount of harm to which each subject is exposed.
As a final note, once an optimal covariate-adjusted analysis of an ordinal or continuous endpoint, using the outcome scale in its original form, is completed, the statistical model can be used to translate the result to any clinical scale desired. For example, from either a linear model or an ordinal response model one can easily compute the probability that a patient will achieve an outcome below any given threshold. So there is no reason to dichotomize the outcome variable for the primary endpoint.
Addendum
Under what conditions is a designation of responder or non-responder useful clinically? Clinicians will certainly have additional thoughts but here’s a start. If all of these conditions are satisfied, a binary characterization may be useful clinically:
- The definition of responder uses only current patient status, or it deals with change from a specific time point and it can be verified that the change score means the same thing for each patient, e.g., that change from baseline is independent of baseline and there are no floor- or ceiling effects in the score or measurement.
- Patients designated as responders are indistinguishable from each other in terms of the quality of their clinical outcome.
- Patients designated as non-responders are indistinguishable from each other in terms of the quality of their clinical outcome.
Of course if the clinical measure originated as a truly “all or nothing” assessment with no other information available, that measure may be used as the responder definition. But for continuous or ordinal measurements, responder dichotomizations should in my view be replaced by matters of degree, e.g., the original scale.
What is an example of the most useful prognostication to convey to a patient? “Patients such as yourself who are at disability level 5 on our 10-point scale tend to be at disability level 2 after physical rehabilitation. Here are the likelihoods of all levels of disability for patients starting at level 4: (show a histogram with 10 bars).”
What are the criteria for a responder definition to have good statistical properties? The conditions are the same as the clinical conditions. If a continuous or ordinal measure is dichotomized to create “responders”, it is necessary that the responders be homogeneous in their outcomes and likewise for the non-responders. For communication purposes it is also necessary that the cutpoint used to create the dichotomization be the same one used in previous studies.
See Also
- Should responder analyses be conducted on continuous outcomes? by Robert Abugov, Jennifer Clark, et al.
- Responder analyses and the assessment of a clinically relevant treatment effect by SM Snapinn and Q Jiang
- Information gain from using ordinal instead of binary outcomes
 .
.