Ben Goldacre & colleagues just published a preprint in which they have screen electronic health records of 17 million NHS patients to explore deaths from COVID-19 by subgroup of co-morbidities etc.
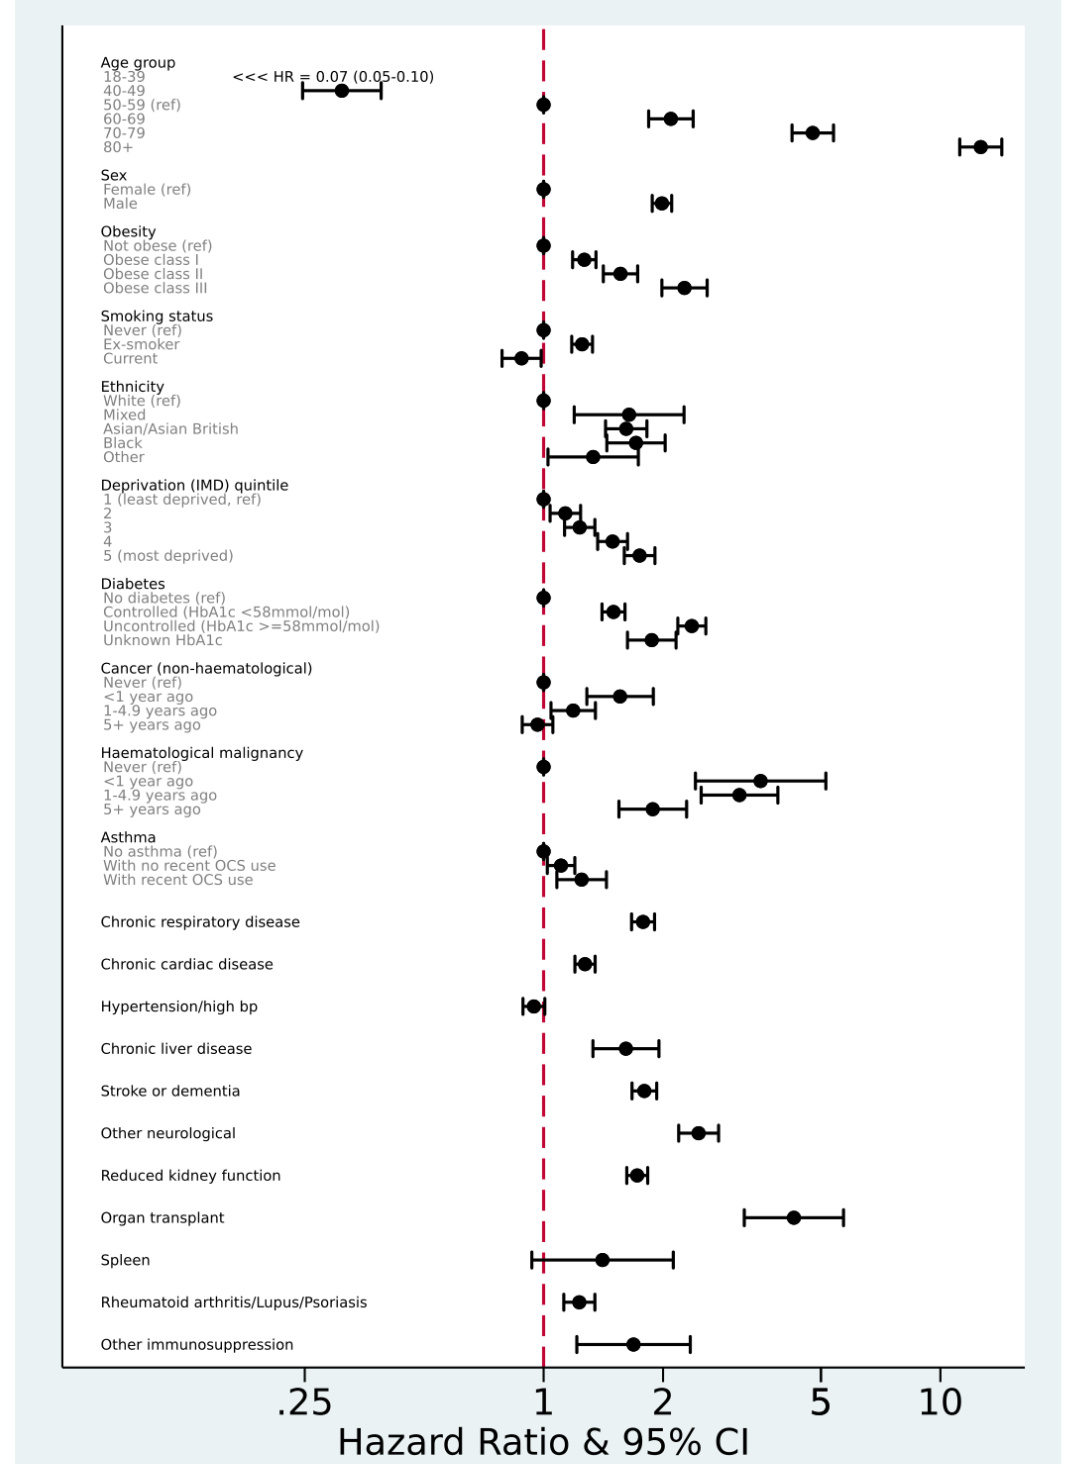
While the work undertaken is impressive, I noticed that the hazard ratios reported in figure 3 is derived from a single Cox model including all covariates. This strikes me as odd if not inappropriate, especially considering the number of covariates and also that we don’t really have an overview on how these covariates relate to each other. This could have been illustrated in a directed acyclic graph which I think would have been useful when you have 21 covariates in the model, many of which are categorical.
I wonder if this potential overadjustment/collider bias may have induced the relationship observed for e.g. current smoker which appears “protective” and can be misinterpreted and misreported? Any insight and discussion regarding this would be very useful.
I agree there seems to be something funny about the way the smoking results are presented. Here’s an excerpt from the text:
“Both current and former smoking were associated with higher risk in models adjusted for age and sex only, but in the fully adjusted model there was weak evidence of a slightly lower risk in current smokers (fully adjusted HRs 0.88, CI 0.79- 0.99). In post-hoc analyses we added individual covariates to the model with age, sex and smoking to explore this further: the change in HR appeared to be largely driven by adjustment for chronic respiratory disease (HR 0.93, 0.83-1.04 after adjustment) and deprivation (HR 0.98, 0.88-1.10 after adjustment). Other individual adjustments did not remove the positive association between current smoking and outcome…”
I don’t understand how you can disentangle the effects of chronic respiratory disease and smoking. As a family physician, I can say that the vast majority of non-asthma-related chronic respiratory disease that I see is chronic obstructive pulmonary disease (COPD), which encompasses emphysema and chronic bronchitis (though there are some COPD cases with overlapping asthmatic features). The overwhelming majority of COPD cases are caused by smoking, so it’s very likely that most of the patients in the non-asthma “chronic respiratory disease” category were either current or former smokers. So in other words, I’m not sure how much sense it makes to report a HR for smoking status “adjusted” for presence/absence of a disease that is itself caused by smoking (??). This gives the impression that smoking is somehow “protective,” when the opposite effect seems much more plausible, both intuitively and judging by the HR associated with “chronic respiratory disease.”
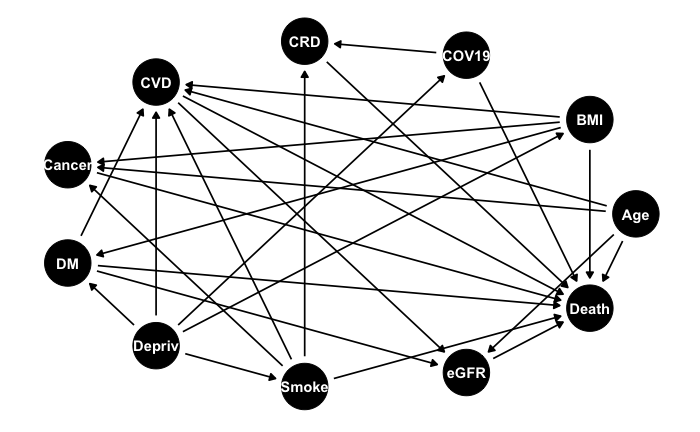
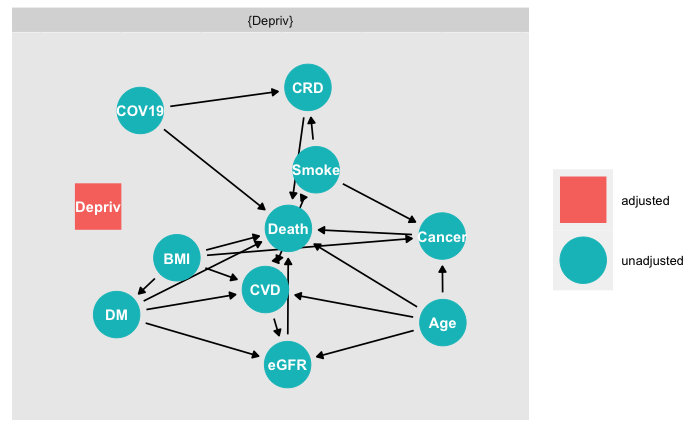
Played around for 15 minutes with ggdag and ended up with this for the association between smoking and COVID-death which looks like a nightmare to interpret. I did not include all covariates, and may have missed some arrows but you get the gist.
 dag<-dagitty::dagitty("dag{Smoke -> Death
 Smoke -> CRD
 Smoke -> CVD
 Smoke -> Cancer
 COV19 -> Death
 COV19 -> CRD
 CRD -> Death
 CVD -> Death
 Cancer -> Death
 Age -> Death
 Age -> CVD
 Age -> Cancer
 BMI -> CVD
 BMI -> Cancer
 BMI -> Death
 BMI -> DM
 DM -> CVD
 DM -> Death
 CVD -> eGFR
 DM -> eGFR
 eGFR -> Death
 Age -> eGFR
 Depriv -> BMI
 Depriv -> CVD
 Depriv -> DM
 Depriv -> Smoke
 Depriv -> COV19
 Smoke [exposure]
 Death [outcome]}")

 tidy_dag<-ggdag::tidy_dagitty(dag)

 ggdag::ggdag(dag, layout="circle") +
   ggthemes::theme_tufte() +
   theme(axis.text = element_blank(),
         axis.title = element_blank(),
         axis.ticks = element_blank())
Besides the resources above, I’ve found that Chapters 5 & 6 in McElreath’s “Statistical Rethinking” https://xcelab.net/rm/statistical-rethinking/ cover examples of when including a variable in a model is right and wrong illustrated with DAGs via daggity.