I don’t have time-dependent c-index implemented (nor am I tempted to). For your first question the calibrate function has an option to use cross-validation instead of the bootstrap. Cross-validation typically takes more iterations than the bootstrap. Sometimes you need 100 repeats of 10-fold cross-validation to get adequate precision.
Thank you for answering this question! Could you please explain the difference between the calplot and calibrate function? I tried to create bootstrap calibration curves using both functions and both look different. I was wondering why this was the case.
calplot must be someone else’s function.
When creating optimism corrected bootstrap calibration curves, the calibrate function with method='boot' as shown below would be used for 2-years follow-up:
data_import$time_to_event_conv=data_import$time_to_event*365
f=cph(Surv(time_to_event_conv,event_censor)~Risk_Score,x=TRUE,y=TRUE,
          surv=TRUE,data=data_import, time.inc=2*365)
calboot<-calibrate(f, method="boot",B=500,u=2*365)
plot(calboot)
For k-fold validation, I would simply use method="crossvalidation" and B=10 for 10-fold validation.
Could you please confirm if this is correct?
Could you please also advise on the loess smoothing factor used with the smoothed calibration curve is created?
Yes although that would be imprecise since you only fit 10 models.
Please read the RMS course notes for details about the calibration method, as well as reading the help file for calibrate.cph. Also note that I edited your post to use back ticks to set off code.
Notwithstanding the insensitive nature of the c-index, we have been challenged by a reviewer to generate bootstrap confidence intervals for a change in c-index between a “simple” and a “full” cph model where we are interested in added value. With rms::validate, one can get the optimism-adjusted (resampling-validated) c-index (i.e. (Dxy/2)+0.5) for both the simple and full models. For either model, one can bootstrap confidence intervals for Dxy (as shown in the following post: Confidence intervals for bootstrap-validated bias-corrected performance estimates - #10 by f2harrell). It is unclear to me (1) whether delta c would correspond to the difference between the two optimism-adjusted c-indexes (i.e. full - simple), and (2) how to bootstrap confidence intervals for this change.
There may be no reliable method to do this and interpretation thereof. Would greatly appreciate any help on these two points.
(For what it’s worth, we also reported output using the lrtest() function.)
Besides the issues already cited, the c-index has a nearly degenerate distribution because it is difficulty for it to fall below 0.5. Differences in c are likely to have odd distributions too. Normal approximations don’t work well for c.
I’m trying to conduct internal validation for my time-to-event model. When I use the calibrate function in rms, I get the predicted and observed probability of survival. How can I plot the predicted and observed probability of the event instead?
The plot method for calibrate doesn’t offer an option for cumulative incidence. But type rms:::plot.calibrate to see the code which will show you the points it is fetching from the results of calibrate() so that you can write the plotting code manually, taking one minus the y-coordinate.
Edit: I think I figured it out. More in my reply.
Thank you, Dr. Harrell. I’m not that familiar with R (I normally use SAS) so I’m wondering if you (or someone else) can tell where I went wrong with my edits to the function. Here are all the bits of code where I made changes (in bold):
[edit: incorrect code removed]
After making these changes, I’m getting “Error in calibplots2(cal_w1) : object ‘surv’ not found” (calibplots is the name of the above function and cal_w1 is the name of the object containing the calibrate function of my model).
In case anyone else runs into a similar problem, I got the function to give me the observed/predicted probability of event by making the following changes:
else {
    type <- "smooth"`
    pred <- 1-x[, "pred"]           #PB: add 1-
    cal <- 1-x[, "calibrated"]  #PB: add 1-
    cal.corrected <- 1-x[, "calibrated.corrected"]  #PB: add 1-
    se <- NULL
  }
I think I did this right but please let me know if I’m wrong!
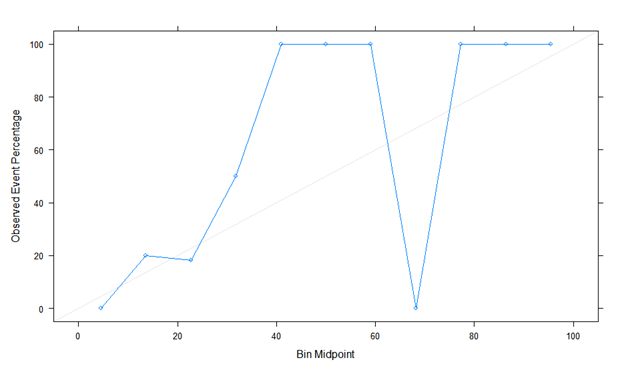
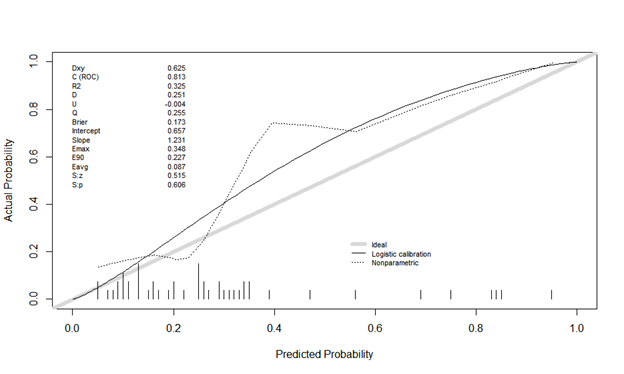
I need to ask about calibration again. I created the LR model and did a calibration plot on the test data (n=49). Below are two variants:
Here is the first calibration plot with binning using Caret. Looks like a true story!

The second is calibration plot using Rms, val.prob (predicted probability, class). The actual probability is odd, and it looks different. Is it plot without binning? Is there something I’m doing wrong?

Estimates from binning should be ignored. You can easily manipulate the shape of the calibration plot by changing the binning method, and it ignores risk heterogeneity within bins.
The minimum sample size needed to estimate a probability with a margin of error of \pm 0.1 is n=96 at a 0.95 confidence level. So it is impossible to do a model validation with n=49 even were all the predictions to be at a single risk value.
It is not appropriate to split data into training and test sets unless n > 20,000 because of the luck (or bad luck) of the split. What is your original total sample size and number of events? And how may candidate predictors were there?
The total sample size is 202 patients and 67 events. The model of LR included 3 predictors.
Were the 3 predictors completely pre-specified?
202 patients is too low for data splitting by a factor of 100. Validation will have to be by resampling (100 repeats of 10-fold cross-validation or 400 bootstrap resamples).
During training the model (n=159), I did 10-CV. Do you mean I should use all 202 patients for CV training? If so, how can I test my model without test data? A one-variable HL test was used to select 3 predictors from 10. It’s not perfect, I know.
The fact that you would probably be overfitted with 3 but you really had 10 variables means that there are serious issues. HL should not be used for variable selection. One repeat of 10-fold CV is not sufficient. All patients should be used for model development and for model validation. That means that 100 repeats of 10-fold CV (or 400 bootstraps) need to re-execute all* supervised learning steps that involved the 10 candidate predictors. WIth your setup the only hope, I believe, is to do data reduction (unsupervised learning) to reduce the dimensionality of predictors down to perhaps 3 (e.g., 3 variable cluster scores such as \text{PC}_1 s), then fit the model on those 3. Variable selection is completely unreliable in your setting.
Let us assume that the selection of predictors was correct. How can I test my data without splitting it? For example, my sample size is 200 or 1000. I train my model with CV. Next, what? Without a test dataset, I cannot check my model. How can I calibrate it?
I need a robust algorithm of my actions for future research.
If my dataset less than 20000 (actually, it’s a huge data) I train my model with CV. Ok! I got a model. Do I assess my model using the same data (accuracy, sensitive, specificity and so on)? In this case, I can get very good metrics and AUC>0.8. But it’s correct or not? I need a test dataset, that I don’t have. If I will be use a train data for calibration, I also get a very good calibration plot.
There are more details in Regression Modelling Strategies (the text by Frank), but you can use bootstrap resamples to do fits on synthetic data, testing your entire modelling process. Here is a paper describing the process.
And if you don’t get the text you can access the full course notes at Regression Modeling Strategies