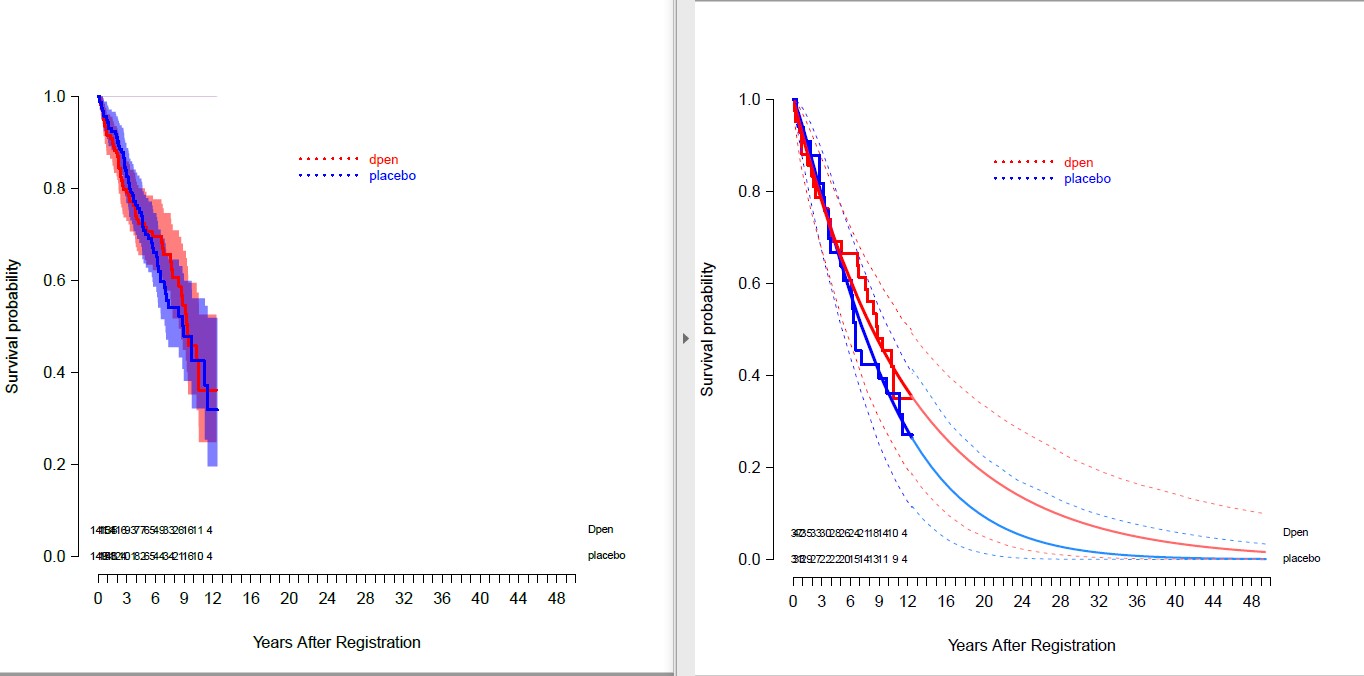
I wanted to know how to fill bands for confidence intervals in the “lines” function applied to survplot.
The left plot shows the confidence bands for Kaplan Meier curves with transparent overlap. I’d like the same for right plot for the parametric curves.
Any help would be greatly appreciated!
Christopher
code below:
# dpen is a drug
dat_dpen <- filter(dat, drug_Dpen_placebo == '1')
dat_placebo <- filter(dat, drug_Dpen_placebo == '0')

survobj_dpen <- Surv(dat_dpen$regis_to_event_d/365.2422,dat_dpen$status_cens_death == 1)
survobj_placebo <- Surv(dat_placebo$regis_to_event_d/365.2422,dat_placebo$status_cens_death == 1)

surv_dpen <- flexsurvreg(survobj_dpen ~ 1,anc = NULL,
                         dist = w)
surv_placebo <- flexsurvreg(survobj_placebo ~ 1,anc = NULL,
                            dist = w)
survobj <- Surv(dat$regis_to_event_d/365.2422,dat$status_cens_death == 1)
par(las=1)
survplot(fit  = npsurv(survobj~factor(dat$drug_Dpen_placebo, labels=c("Dpen", "placebo"))),
         #conf = c("none"),
         conf = c("bands")[1],conf.int = .95, col.fill= c(rgb(red = 1,green = 0,blue = 0,alpha = 0.5),rgb(red = 0,green = 0,blue = 1,alpha = 0.5)),
         xlab = "Years After Registration", ylab = "Survival probability",
         xlim=c(0,50),
         label.curves = FALSE,
         levels.only  = TRUE,                    # show only levels, no label
         time.inc = 1,                           # time increment
         n.risk   = TRUE,                        # show number at risk
         lwd = 2,
         lty = c(1,1),
         cex.n.risk = 0.7,
         adj.n.risk = 0,
         col = c("red","blue"),
         col.n.risk = c("red","blue")
)
legend(x=20,y=.9,bty="n", legend=c("dpen", "placebo"), text.col= c("red","blue"),
       lty=c(3,3),lwd=2,col = c("red","blue"),seg.len=5,cex=0.85)
dev.off()


# fitted to data
lines(surv_dpen,type = "survival",ci = T, xnt="n",col = c("blue"),lty= c(1),
      ci.lwd= 3,lwd = 3)
lines(surv_placebo,type = "survival",ci = T,xaxt="n",col = c("red"),lty= c(1),
      ci.lwd= 3,lwd = 3)