Oddly enough the recommendation is not to include the interaction term but but to have the estimated cumulative hazard as a variable.
Thanks!
In the end of the paper you cite, they mention that Predictive Mean Matching (PMM) didn’t perform very well and requires future study. Is there an alternative approach you’d recommend, or should I stick with PMM?
I’d need to know why PMM didn’t work, and to what extent, since I believe it’s such a good default method in general.
And here’s another example of categorization, straight from yesterday’s headlines (see table in article). And all the way down to two decimal places! The CDC’s main recommended action threshold is between “moderate” and “substantial.” So 49.99 cases per 100K versus 50.00 cases per 100K, or 7.99 versus 8.00 percent of tests positive. Boggles the mind.
Silliness and arbitrariness abounds! The same kind of thinking that misled CDC for decades about air transmission of viruses as a function of particle size.
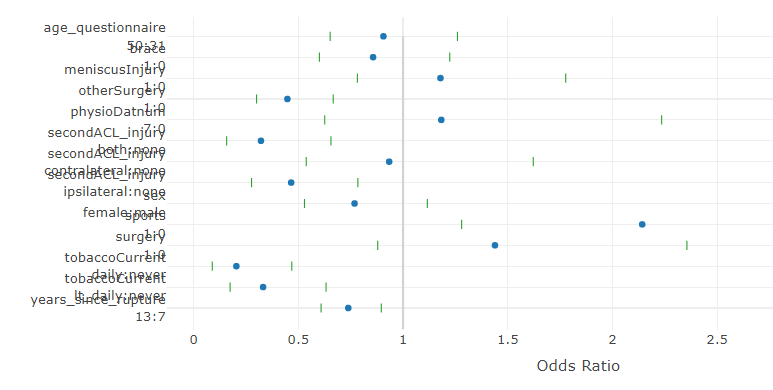
When I create a plotly graph of the summary plot for an rms model eg plot(summary(model)) I have a problem with overlapping text on the y axis. Any ideas on how to fix this? Not sure it makes any difference but the model I’m creating is a bayesian proportional odds model using blrm.
If you can run the following and attach the resulting s.rds file here I can debug.
s <- summary(model)
saveRDS(s, 's.rds')
Sorry I can’t work out how to attach a file…
When you hit Reply there is a little upload icon in the middle of a series of icons at the top of the editing window.
I have created a prognostic nomogram using rms package of R. The nomogram contains 11 variables. I am interested in calculating the predicted point scores for each patient from the nomogram and use it as a continuous covariable in my dataset. I would really appreciate it if someone can please help me with it.
Please get the nomenclature correct. You have fitted a model with 11 predictors (hopefully with nonlinear effects included as it’s unlikely that all the relationships for continuous predictors are linear). You wish to graphically depict the fitted model. One graphic for doing so is a nomogram. If you want point scores that are due to each predictor, just print() the object returned by nomogram. If you want to actually get predicted values for individual patients then use one of these rms package functions: predict, Predict, Function, or latex. Look at Function first. It creates an R function to evaluate the linear predictor (e.g., the log relative hazard in the survival model). You can write another step to convert the linear predictor to a survival probability. The Survival function in rms helps with that, or you can use survest.
1 Like
Prof. Harrell,
Thank you very much for your prompt reply and my sincerest apologies for the wrong nomenclature. You are right that I want to calculate the risk score for each patient. Later on I want to do something which I am sure you won’t agree with. I want to dichotomize the patients into two cohorts based on their risk score and calculate the survival of the two risk groups. But that is what the journal editors or reviewers want.
The upload button only allows me to upload specific file types. rds is not one of them.
Darn. Can you upload somewhere (https://temp.sh looks like a good place; stores for 3d) and post the retrieval URL in a reply?
I should have thought of that! My company firewall blocks temp.sh but I’ve posted the file here https://file.re/2021/08/03/painsummary/. It will however be deleted after 24 hours.
1 Like
Hi there, I am trying to build a nomogram using my data. This is what my data looks like:
str(train_sa_nomo)
‘data.frame’: 240 obs. of 8 variables:
PATIENT : chr “TCGA-CS-4938” “TCGA-CS-4941” “TCGA-CS-4943” “TCGA-CS-5394” …
AGE : Factor w/ 2 levels “<=41”,“>41”: 1 2 1 1 2 2 1 2 1 2 …
SEX : Factor w/ 2 levels “Female”,“Male”: 1 2 2 2 1 2 2 1 2 1 …
grade : Factor w/ 2 levels “G2”,“G3”: 1 2 2 2 2 2 2 2 2 1 …
seizure history: Factor w/ 2 levels “NO”,“YES”: 2 1 2 2 1 2 2 2 1 2 …
MONTHS : num 117.41 7.69 36.33 0.26 53.58 …
STATUS : num 0 1 1 0 0 1 1 0 0 0 …
rs : Factor w/ 2 levels “high”,“low”: 2 1 1 2 1 1 2 1 2 1 …
But unfortunately I have been running into problem with this step:
attach(train_sa_nomo)
d ← datadist(train_sa_nomo)
Warning message:
In datadist(train_sa_nomo) :
rs is a matrix or has incorrect length; ignored
The variable ‘rs’ is not included in the model because of that warning. I don’t know how to solve this problem. Can anyone face this problem before?
You are trying to build a model. A nomogram is something you draw to represent the model—one of many ways to graphically depict a model.
The message you received is just a warning and should be ignorable. But don’t use attach().
1 Like
Thanks for the object to test this on. This will be fixed in the next release of rms on CRAN. In the meantime you can put the new fix into effect this way:
require(rms)
source('https://raw.githubusercontent.com/harrelfe/rms/master/R/summary.rms.s')
options(grType='plotly')
plot(summary(...))
1 Like
Thank you Prof. Harrell for your rapid response. When I just removed the function attach() as your suggestion, it has worked well.
Now I’m facing a new problem. I’m planning to construct the calibrate curve to validate prediction performance of the model. The below is the error:
graph ← calibrate(mod.cox, method=“boot”, B = 500, u =12*5)
Using Cox survival estimates at 60 Months
Error in polspline::hare(S[, 1], S[, 2], fun(curtail(est.surv)), maxdim = maxdim, :
negative data
I don’t understand what the problem means
I’m not sure. Check that you have a large number of observations with survival/censoring time > 60.
1 Like