I was referring to no workaround for a contrast of survival probabilities at a fixed time.
For lrm I did not implement ‘no intercept’ models.
I was referring to no workaround for a contrast of survival probabilities at a fixed time.
For lrm I did not implement ‘no intercept’ models.
Sorry for replying to this earlier post.
I read this and want to confirm that you are replying to this question,
Can you (or is it appropriate to) calculate a p-value from this adequacy index to quantify the difference between the models?
you mentioned the way to calculate p value:
You can compute p for (1+2) - (1) and (1+2) - (2).
Is it implemented by running anova(fit, test = “LR”)?
For example, I make a example. f <-cph(S ~ age +sex, x=TRUE, y=TRUE)
anova(f, test = "LR")
                Likelihood Ratio Statistics          Response: S

 Factor     Chi-Square d.f. P
 age        0.81       1    0.3673
 sex        0.07       1    0.7965
 TOTAL      0.85       2    0.6548
The p-value of the difference between age +sex and only age is 0.7965.
The improvement/adequacy index is 0.07 / 0.85 = 8%.
Is my understanding correct? And would you recommend showing this p-value with adequacy index ? Thank you very much.
This kind of inconsistency of the two measures is likely to happen in small samples, just as you can get a large but “insignificant” increase in R^2. If you computed a compatibiity interval for the increase in the performance index you’d see the uncertainty interval is pretty wide.
Thank you.
How do I calculate the compatibility interval of the adequacy index?
You can do the bootstrap ‘manually’ in R, or use relative explained variation instead for which the rms rexVar function works with the bootcov function to get bootstrap uncertainty intervals.
Hi there,
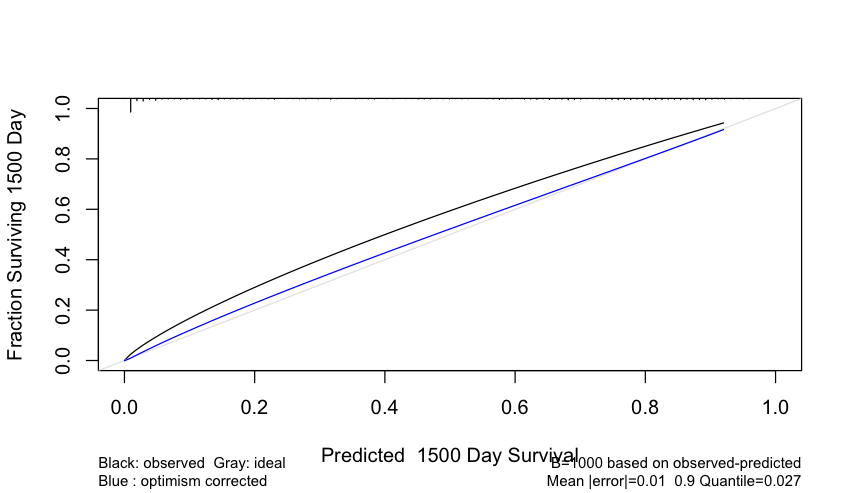
I need to subset the Mean|error| and the 0.9 Quantile information that is shown in the calibration plot of cph models.
For my case, it is a cox model and the plot looks like this:
I’ve seen this columns in the matrix,
colnames(calibration_sparse_avas_trans)
[1] “pred” “index.orig” “training”
[4] “test” “mean.optimism” “mean.corrected”
[7] “n” “calibrated” “calibrated.corrected”
but I do not know how to subset or compute the Mean|error| and 0.9 Quantile. could you please help me to get these values?
Thank you in advance
Marc
I wish I had capture those computed quantities and not just printed them. The best bet is to write a little function that takes the object created by calibrate() and does part of what is in rms:::print.calibrate. You’ll see where the err vector is computed, for example, then where the mean and 0.9 quantile of absolute err are computed. Instead of printing, return those pieces as the new function’s result.
Thank you, it worked well.
Just as information, I had to change the quantile calculation, using abs(err) instead of err. With the code shown by rms::print.calibrate (attached) it doesn’t compute the correct quantile value shown in the plot.
else if (length(predicted)) {
s ← !is.na(x[, “pred”] + x[, “calibrated.corrected”])
err ← predicted - approxExtrap(x[s, “pred”], x[s, “calibrated.corrected”],
xout = predicted, ties = mean)$y
cat(“\nMean |error|:”, format(mean(abs(err))), " 0.9 Quantile of |error|:",
format(quantile(err, 0.9, na.rm = TRUE)), “\n”, sep = “”)
}
Modified code:
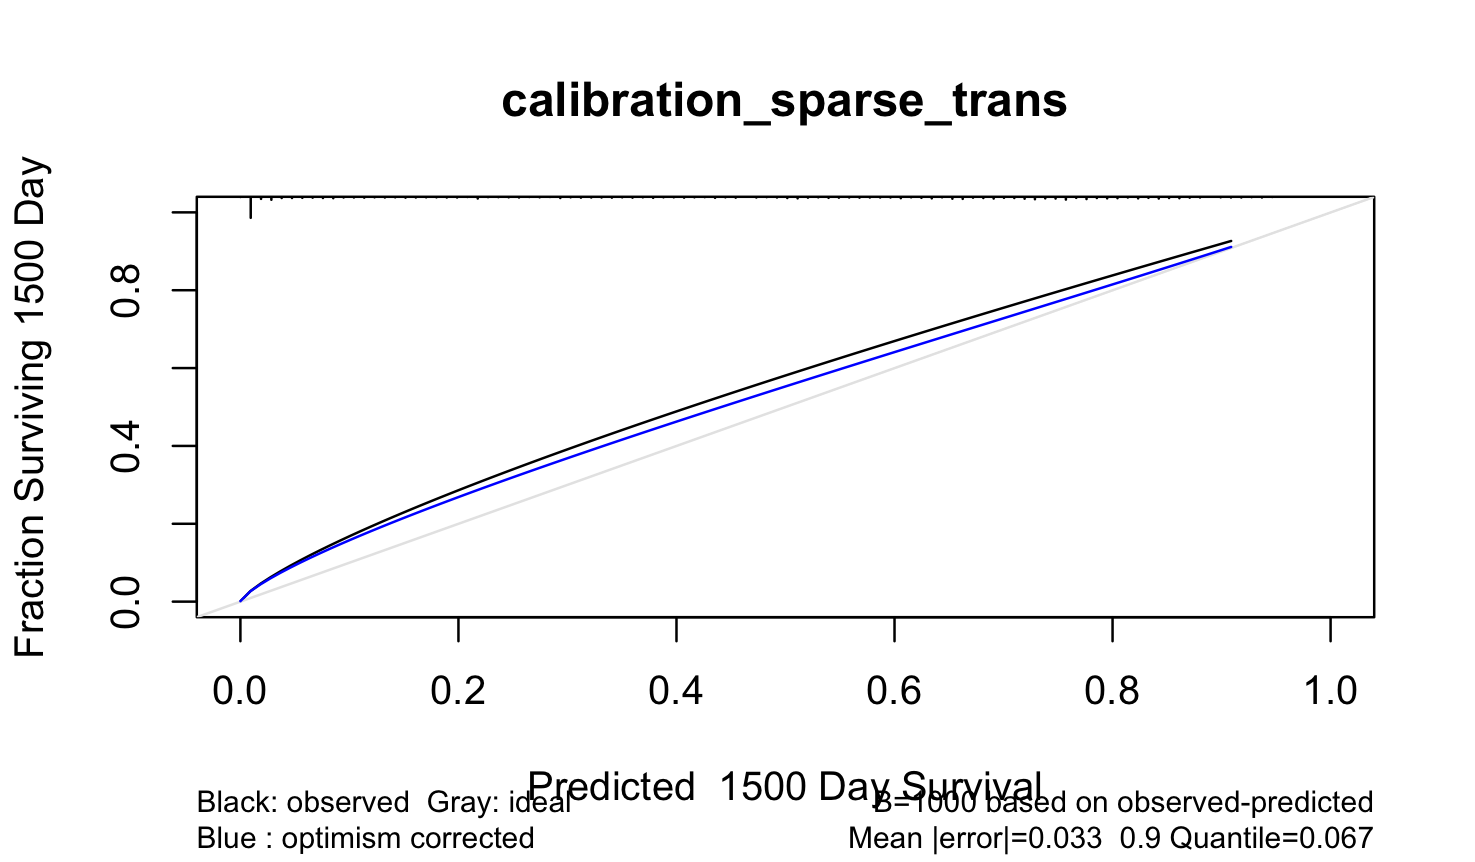
err ← attr(calibration_sparse_trans, “predicted”) - approxExtrap(calibration_sparse_trans[sss, “pred”], calibration_sparse_trans[sss, “calibrated.corrected”], + xout = attr(calibration_sparse_trans, “predicted”), ties = mean)$y
cat(“\nMean |error|:”, format(mean(abs(err))), " 0.9 Quantile of |error|:", + format(quantile(abs(err), 0.9, na.rm = TRUE)), “\n”, sep = “”)
Output:
Mean |error|:0.03250078 0.9 Quantile of |error|:0.06672416
Regards,
Marc
Hi all,
Could someone please clarify the role of the inclx argument in rcspline.eval()? I note that it is false by default, but it is set to true internally in rcs(). What effect does this argument have on the fit/estimated non-linear function?
You would only set it to FALSE if the linear term had already been included in the design matrix by other means. Never fit a model without it.
Hi there,
I have a question regarding the validation and calibration procedure of a model that has been fitted using both sides X and Y (using avas()) transformation.
.
cph_pca_avas_trans ← cph(formula, data = dataset, surv=TRUE, time.inc=1500, x=TRUE, y=TRUE)
boot_validation_pca_avas_trans ← validate(cph_pca_avas_trans, method = “boot”, maxiter= 1000, B = 1000)
calibration_pca_avas_trans ← calibrate (cph_pca_avas_trans, u=1500, maxiter= 1000, B = 1000, maxdim=3)
The data.frame ‘dataset’ includes both transformed X and Y
My question is: how can I estimate the time for which I want to compute the calibration curves? time.inc= and u=
As the outcome Y (in raw values it was days) has been changed arbitrarily I do not know for which time to estimate it. I tried some values but I get an error message:
Error in polspline::hare(S[, 1], S[, 2], fun(curtail(est.surv)), maxdim = maxdim, : negative data
And another question is: Can I fit the model and validate/calibrate the model with avas() transformed X variables and keep the original values of Y? I did this by error and the tests I get are quite good, but I do not know if this makes sense.
Thank you in advance for your help!
AVAS and ACE only work with area.boot which only handles uncensored data. You approach is ignoring uncertainties in transformations.
Thank you for your comments professor Harrell. Is there any way to manage/assess these uncertainties so to be able to use the functions included in the rms package such as calibrate() and validate()?
No, you’d have to program this using area.boot as an example. How are you implementing the Cox partial likelihood to handle censoring when doing avas? I’m not aware of available software that does that.
The rms package wants you to use parametric regression splines, which usually work just as well as GAMs, avas, and ace.
Thank you again for your quick reply. What I did is the following:
Apply avas transformation to the original variables x,y:
avas ← avas(x, y)
Create a new dataset, with original outcome y and transformed x:
avas_trans ← cbind(y, g[,c(“STATUS”)], avas$tx)
avas_trans ← as.data.frame(avas_trans)
Run the cox model with cph() function:
cph_cox_model_avas_trans ← cph(Surv(MTBR, STATUS) ~ x1 + x2 + x3 , data = avas_trans, x=TRUE,y=TRUE, tol=1e-13, ties = ‘efron’, id = id)
I compuite the relative likelihood of each transformed covariate from the fitted model with anova() function.
anova(cph_cox_model_avas_trans, test=‘LR’)
Later, validate() and calibrate() the model cph_cox_model_avas_trans and check for the indexes and overfitting issues.
Do you find important inconsistencies in what I did?
I’m not getting the motivation for this. The Cox model is transformation-invariant (in the realm of 1-1 transformations that are ascending). So you don’t transform event times when handing them to Cox.
Hi professor,
I’ve tried such transformations in order to see if they would improve the model while improving the overfitting. What I found plotting the # components vs AIC is that the results seem to be slightly better using avas or ace transformations than with splines with less components.
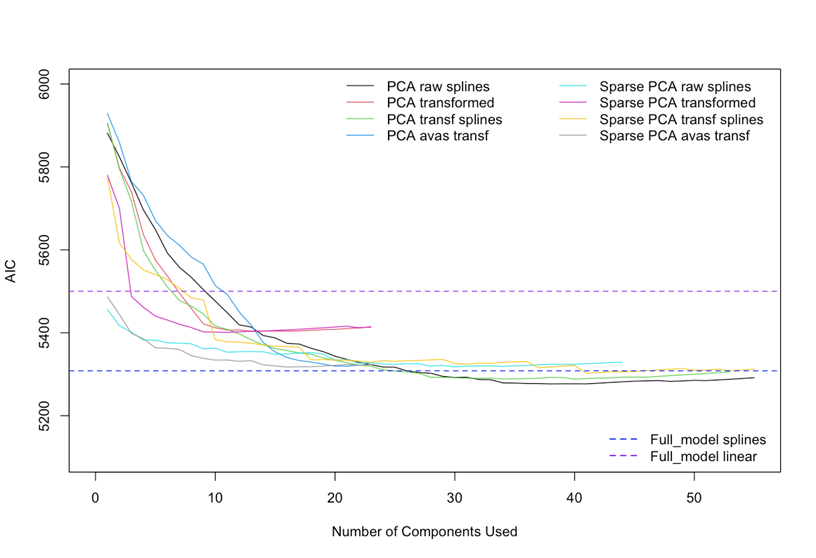
Maybe there is the risk of losing interpretability and uncertainty about an eventual violation of the model assumptions, but at this stage it seems that those models perform a little bit better.
Pre-transforming one or more Xs can be a good idea. But you were also pre-transforming Y for a Cox model, which didn’t make sense to me. Pre-transformation should involve only unsupervised learning, i.e., should not be informed by Y. As in nonlinear PCA.
Hi, dear professor Harrell,
I encountered an issue while using the rms package. When I was using cph, I got the following warning:
formula.character(object, env = baseenv()): Using formula(x) is deprecated when x is a character vector of length > 1. Consider formula(paste(x, collapse = " ")) instead.
I also found similar issue on the rms package’s GitHub page (The link has a detailed description). If you have time, I’d appreciate it if you could take a look. Thank you!
I think your are not using rms 6.9-0.