Dear @f2harrell, I’m trying to get a good understanding of what there is behind the equations currently used to estimate glomerular filtration rate. I’m currently focusing on the CKD-EPI creatinine 2021 where linear regression is used to model ln(GFR) according to ln(creatinine), age (on natural scale), and sex ( paper )
This is what the authors claim in the supplementary appendix
As we have previously described, CKD-EPI equations are modeled using least squares linear regression to relate log transformed measured GFR to log-transformed filtration markers, age, and sex with two slope splines for creatinine. The splines are two phase linear splines on the log scale. For creatinine, the knot is at 0.7 mg/dl for women and 0.9 mg/dl for men
This is how they report the equation in the general form (natural scale)

I have a simulated dataset with GFR, creatinine, sex, and age, and I’m trying to reproduce their model developing process to have a better understanding.
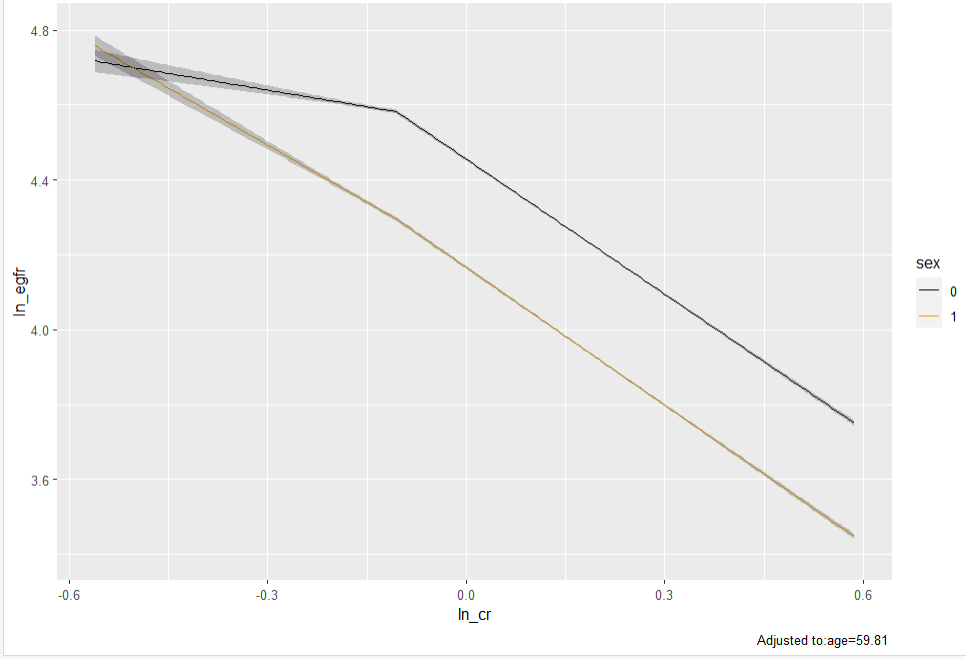
I use linear regression to model ln(GFR) with ln(cr), age (natural scale), and sex. ln(cr) is modelled as linear spline with one knot at ln(0.9) and ln(cr) X sex interaction is allowed.
# knot
k <- 0.9
ln_k <- log(k)
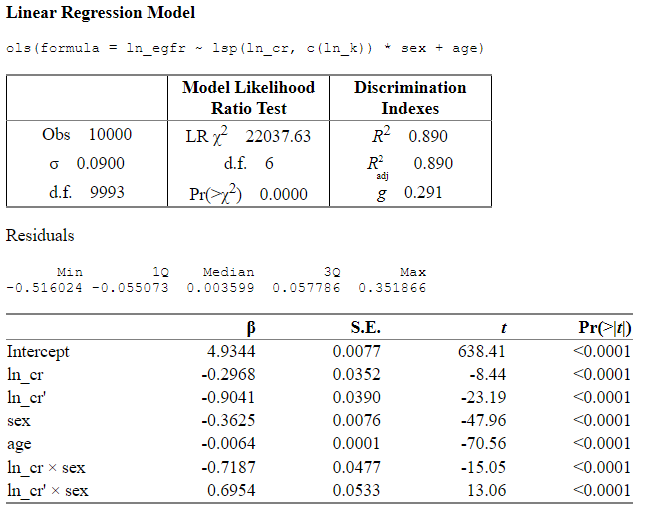
fit <- ols(ln_egfr ~ lsp(ln_cr, c(ln_k)) * sex + age)
ggplot(Predict(fit, ln_cr, sex))
fit
And this is how I would write down the full model in log or natural scale
# log scale
coef(fit)["Intercept"] +
  coef(fit)["ln_cr"]*log(cr) +
  coef(fit)["ln_cr'"] * pmax(log(cr/k), 0) +
  coef(fit)["sex"]*sex +
  coef(fit)["age"]*age +
  coef(fit)["ln_cr * sex"]*log(cr)*sex +
  coef(fit)["ln_cr' * sex"]* pmax(log(cr/k), 0)*sex

# natural scale
exp(coef(fit)["Intercept"]) *
  cr^coef(fit)["ln_cr"] *
  pmax(cr/k, 1)^coef(fit)["ln_cr'"]*
  exp(coef(fit)["age"])^age*
  exp(coef(fit)["sex"])^sex*
  (cr^coef(fit)["ln_cr * sex"])^sex *
  (pmax(cr/k, 1)^coef(fit)["ln_cr' * sex"])^sex
My main questions are
-
How did the authors end up with knot located at two different points using the same dataset (0.7 and 0.9 for female and male, respectively)?
Does this imply that they fitted the model separately for the two subgroups? -
In their equation, min(Scr/k,1)^α * max(Scr/k,1)^-1.209 is the term used to express the effect of creatinine. The left part is 1 when cr is above the knot and the right part is 1 when cr is below the knot. But if my understanding of linear spline is right, this is not how they are supposed to work (the first term should not be “null” when the variable is above the knot and viceversa).
Thank you very much.