There is a paper J Classif. 2020 Oct; 37(3): 696–708. that outlines an important point which is that using a linear interpolation from the ROC curve with binary predictors which is most commonly done in software (R, Python, Stata, and SAS) can lead to misleading results.
I think there is a simple solution to avoid the pitfall of current methods being used as follows:
Lets take the data in Table 1 of the paper, this generates a odds ratio of 2.321429
ln OR = 0.8421828
exp(lnOR/2) = 1.5236235
thus Odds(AUC) = 1.5236235
Thus AUC = 1.5236235 / 2.5236235 = 0.6037
I think this solves the problem for univariate binary predictors because the OR is threshold independent and thus acts as a transform of the AUC. Any thoughts on this would be appreciated
I’m not clear on why anyone uses interpolation. The AUROC (c-index; concordance probability; proportional to the Wilcoxon statistic) has a simple closed-form solution. It’s a simple translation of the mean rank of X within Y=1 whether X is continuous or binary.
I don’t know either. I invited John Muschelli to datamethods to comment on this as well as to point out errors on the simple formulation I suggested. I note that in Stata using rocreg versus lroc after logistic gives different AUCs and these two are also different from the one I suggested above
I am getting a value of 0.2072829 for Somers D for the below data as you suggested
Thus Harrell’s c = AUC = (D+1) / 2 = 1.2072829 / 2 = 0.6036 which is very similar to my simple calculation from the OR of 0.6037 but then the OR will only work for a single binary predictor so these software packages that produce AUCs should all just use Harrell’s c and we get consistency - right?
And, if we have a single binary predictor is there any issue with just using the OR?
One more question - you said in your blog that “Comparing two c-indexes (one from the base model and one from the larger model containing the new biomarkers) is a low-power procedure.” But if we now agree that the OR is an effect measure then the AUC is an effect measure and Harrell’s c is also an effect measure so changes in these parameters should correlate with better outcome discrimination consistently - should they not? So what exactly did you mean by low power?
I agree with the closed form definition, but geometrically, you can see in that paper that that definition uses an “interpolation” of the onobserved sensitivities and specificities that cannot be achieved since the predictor is binary.
Yes but no interpolation is needed. The closed form is complete. I’d even go so far as to say that the act of drawing the ROC clouds the issues. Instead think of a plot where binary Y is on the x-axis and binary, ordinal, or continuous X is on the y-axis. You have two series of vertical dots. The proportion of pairs of dots (one with Y=0, one with Y=1) with a positive slope plus 1/2 the proportion with a zero slope is the concordance probability (c-index) which happens to equal the AUROC in the binary Y case. You can see readily why c is a measure of pure discrimination with this graph.
I agree with that, but the fact that it’s called an “Area Under the ROC Curve” is how people interpret it and I believe that curve should be drawn with step functions (aka no interpolation between points).
The ROC curve should be drawn so that its area is the concordance probability. But things are so much clearer when you drop the curve and just talk about concordance. I’ve seen thousands of ROC curves but not a single one that provided any actionable insights.
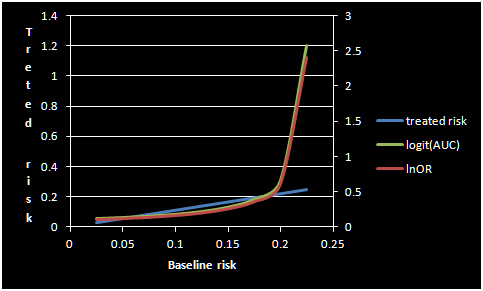
Regarding the point you raised about the OR and AUC, my take on this is that this is just a re-scale of the AUC (0.5 to 1) to between 1 and infinity on the diagnostic OR scale. So my first post was a simple attempt at re-scaling this the other way so we can derive the AUC from the OR. They have to be measuring the same thing since there is a single diagnostic OR for any given (symmetrical) ROC curve. The plot below shows ln/logit on the secondary Y axis and assumes the RR is constant at RR = 1.1
Oh my goodness - that’s a brilliant article and although I have had a superficial read it seems several pieces of the puzzle are now coming together! Will read properly and post how I see the dots connected next …
Taking the cue from your article, lets say when treatments are denoted A=1 and A=0, the c-index is the probability that a randomly chosen patient receiving treatment A=1 has a value of Y that exceeds that of a randomly chosen patient receiving treatment A=0. Therefore if we randomize pairs of subjects with one allocated A=0 and the other to A=1 within each pair, and if the outcome is binary, then say of the total discordant (on outcome) pairs, x, there are n pairs that have y=1 | A=1 then among these discordant pairs:
Pr(y=1 | A=1) = n/x = c-index
therefore c-index / (1 - c-index) = odds(AUC)
And thus odds(AUC) ^2 = OR (my formulation)
The problem is that Fred Hoppe equated odds(AUC) (not its square) with the OR so I guess we need to invite Fred here to see if something is missing in the logic here
I have just realized that the c-index for Fred Hoppe’s example in Table 1 is 0.561 which can also be worked out from 1/OR. Thus
1/0.61 = 1.639
sqrt(1.639) = 1.28
c-index = 1.28/2.28 = 0.561
Fred Hoppe had Pr(y=1 | A=1) = 0.3782 and Pr(y=1 | A=0) = 0.6218 so neither was the c-index