I am assessing proportional hazards using Shoenfeld residuals and have an interesting question as far as interpreting a plot vs. cox.zph() output. The following plot shows my residuals and a red abline using the coef() function for the plotted variable.
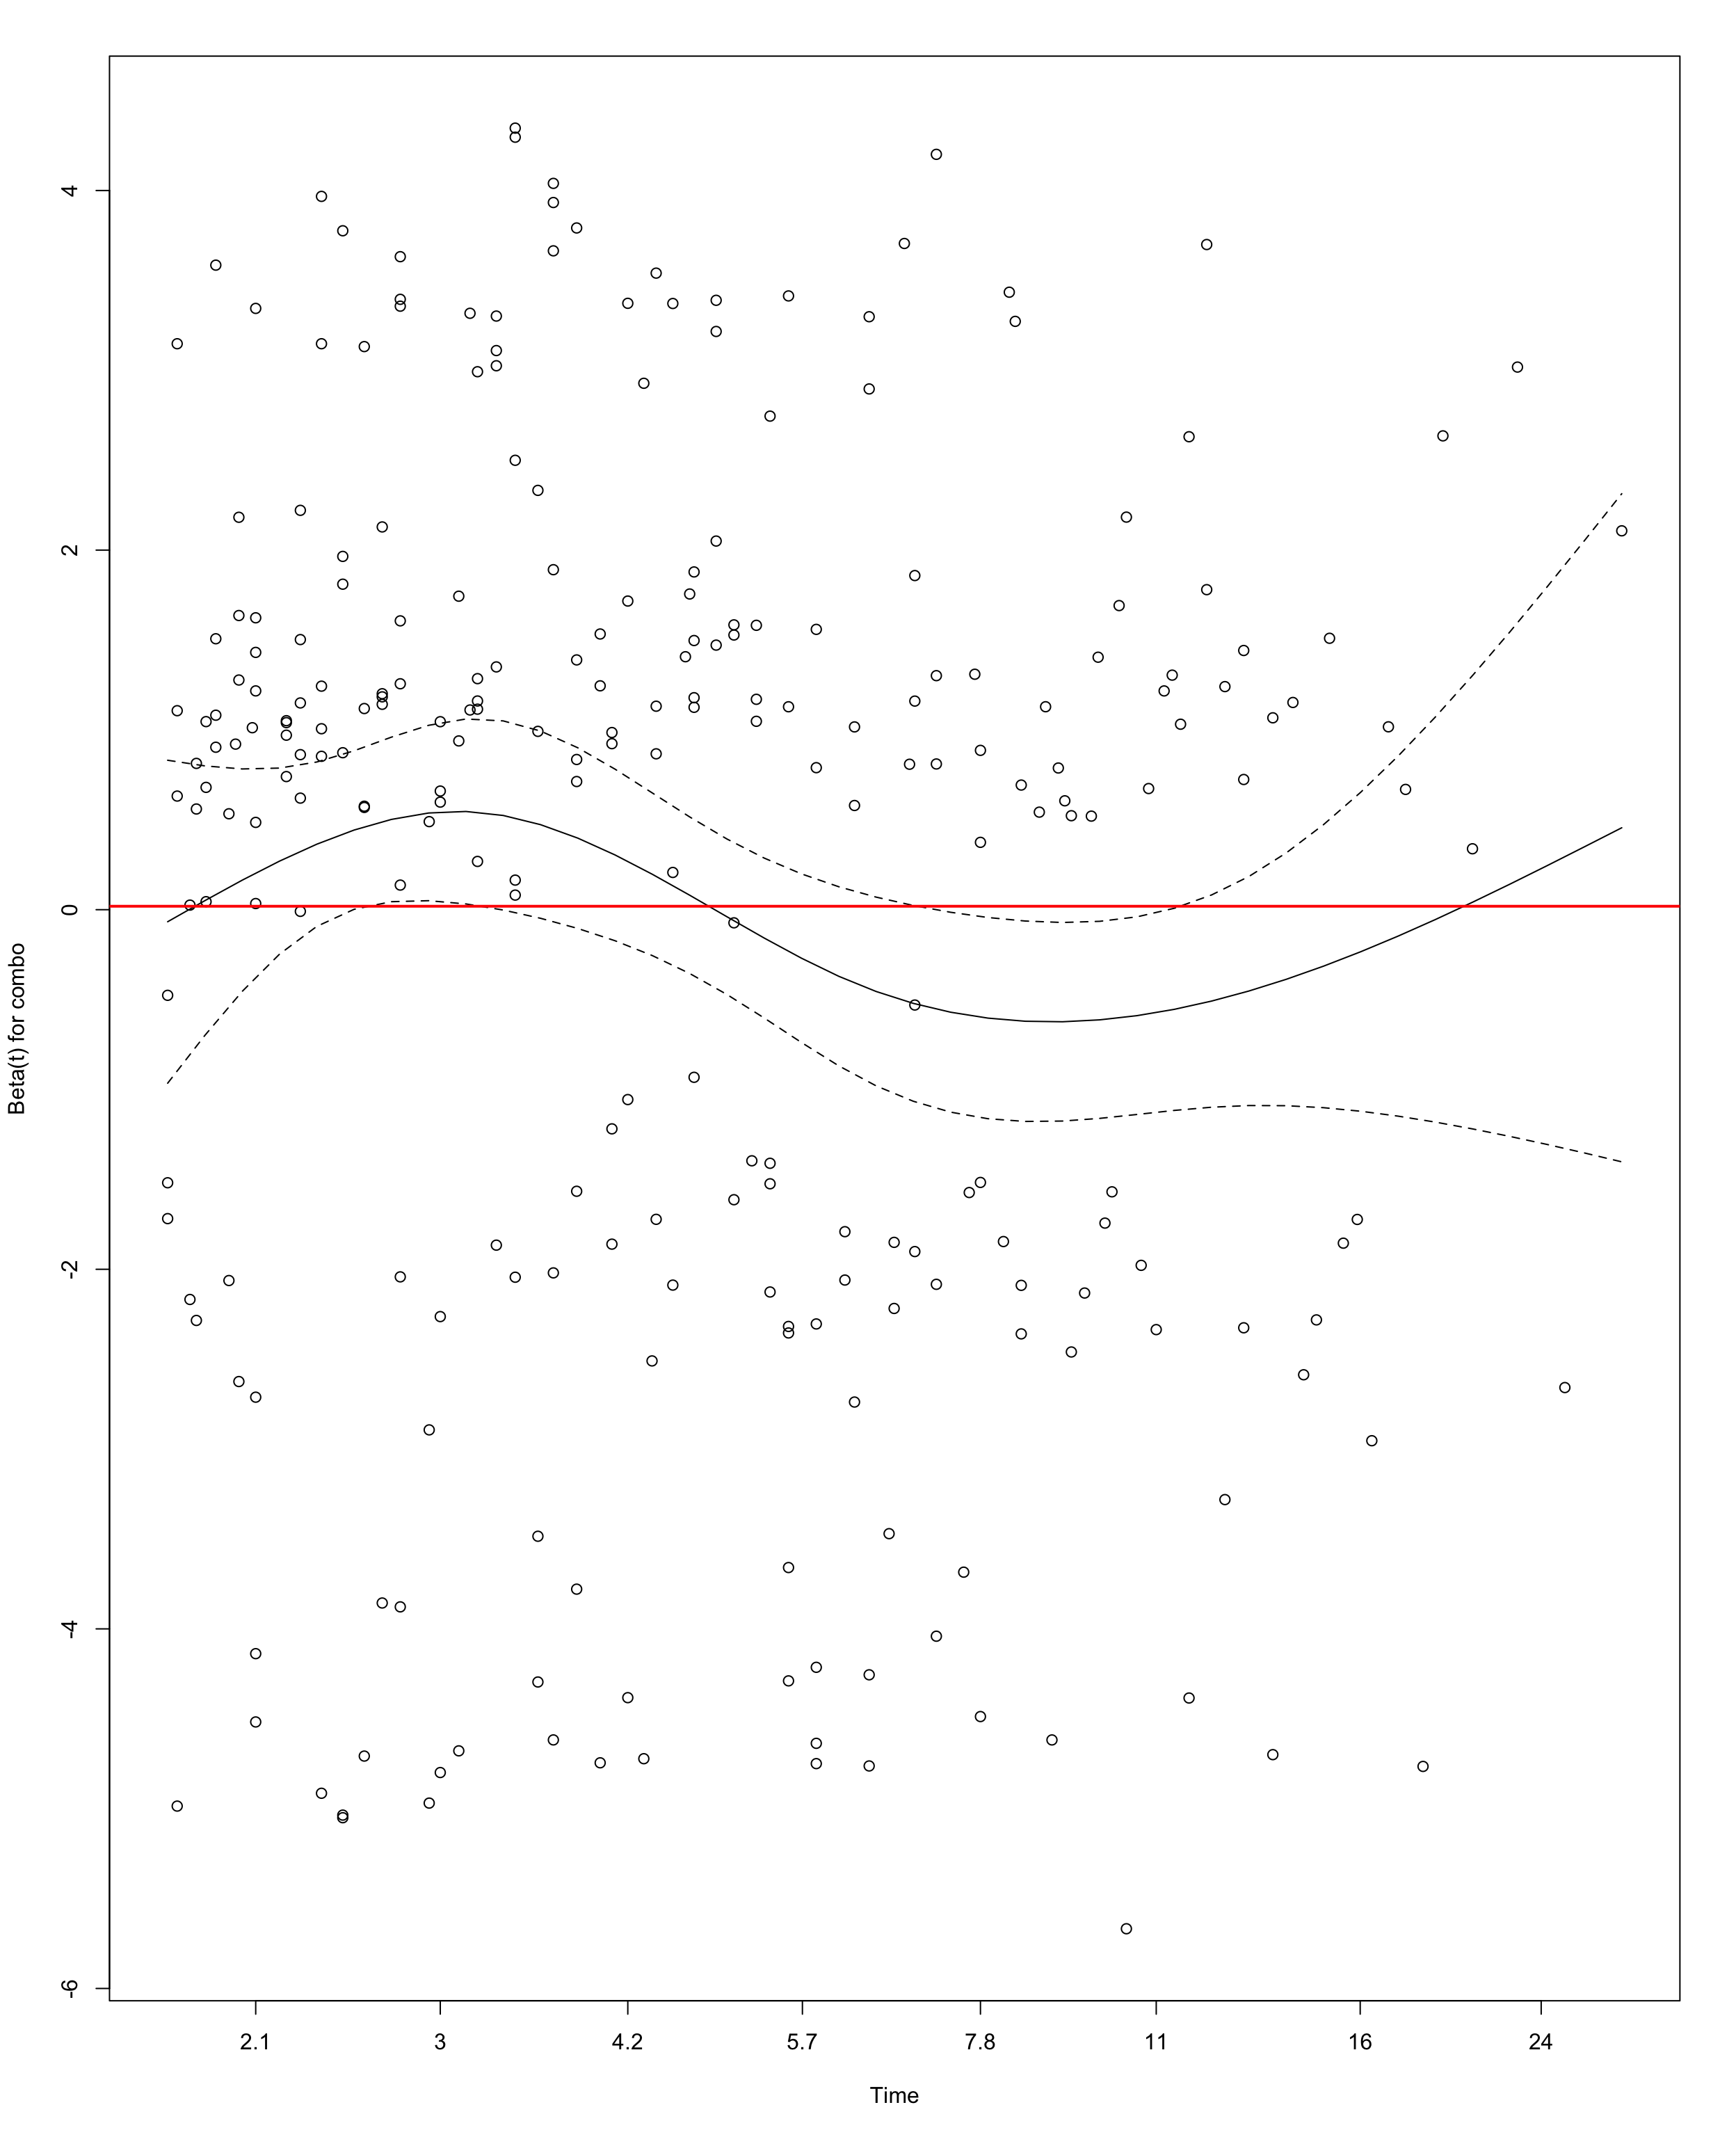
The p-value attained for this variable from cox.zph() is ~0.02. I was just curious why the p-value suggests proportional hazards does not hold when the residuals appear to be pretty evenly spread around 0. For further context this is a categorical variable and the separation in the residuals is driven by the category.