Dear profesor @f2harrell and datamethods community.
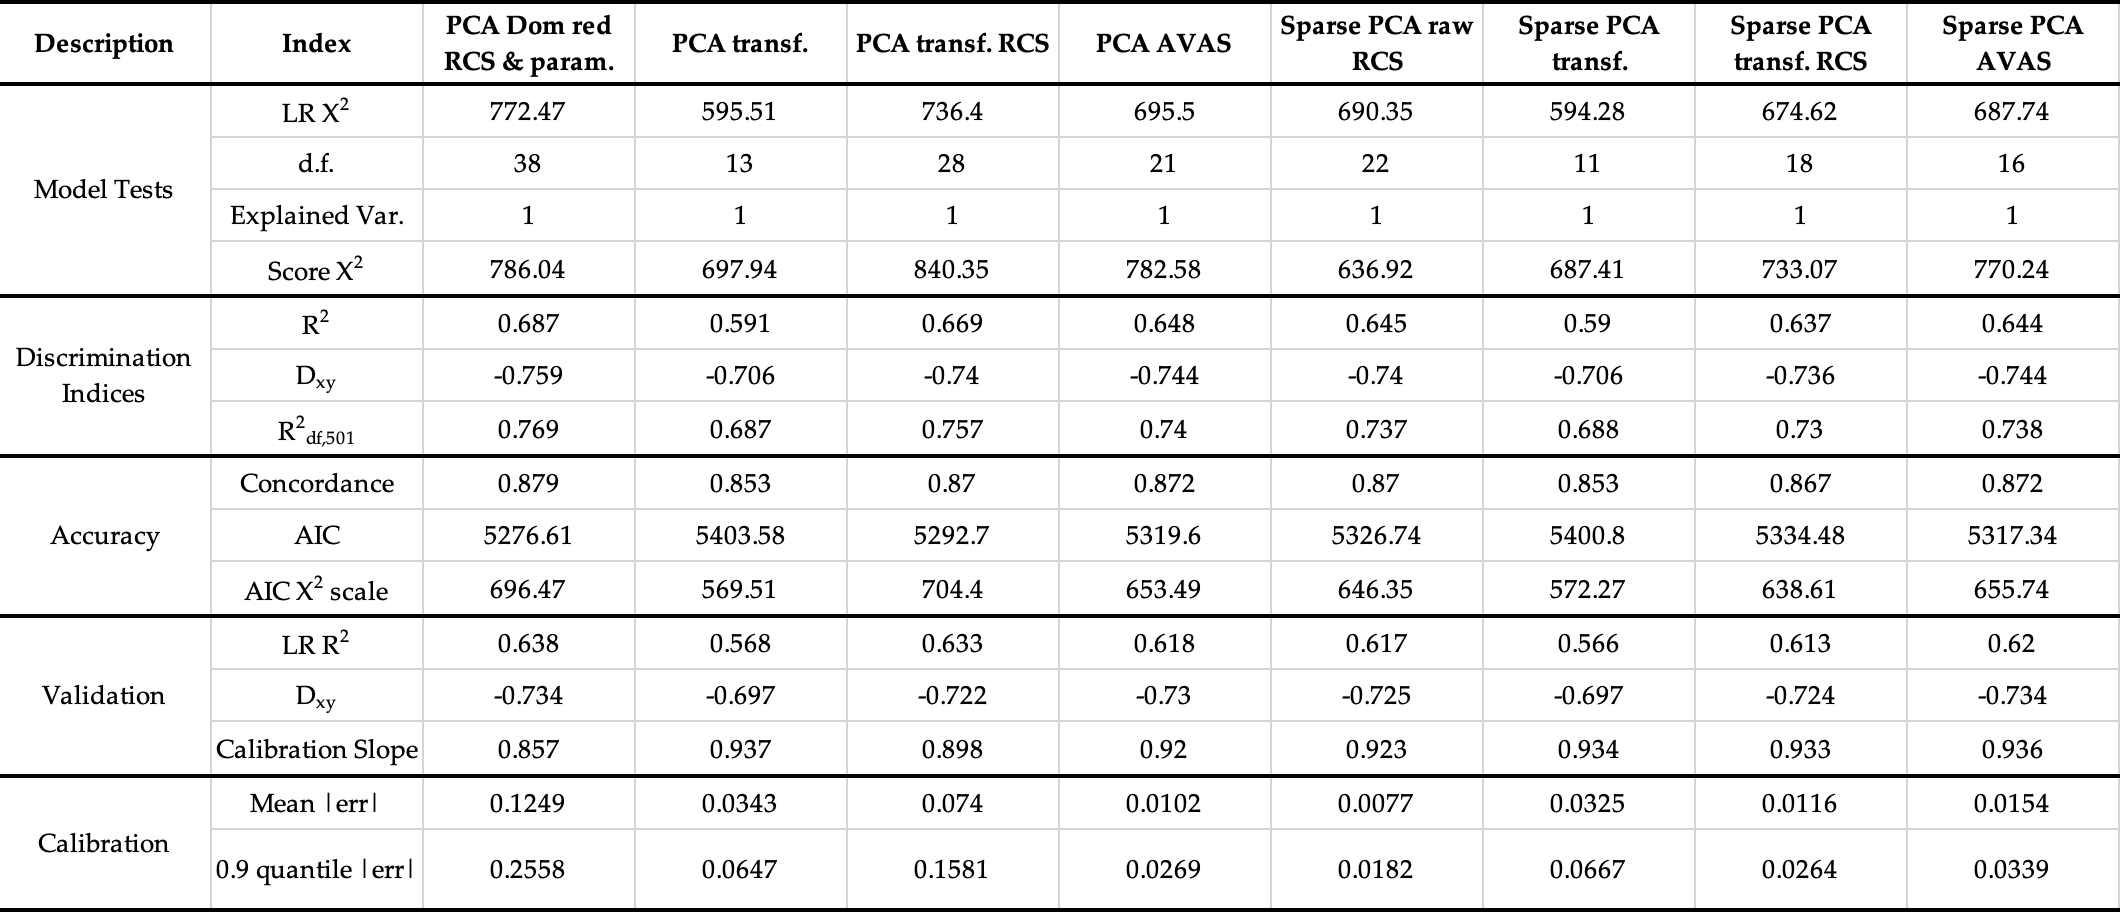
I want to summarize different Cox models that I have fitted in order to try to show in a glance the most important parameters.
This is the table that I am proposing but I do not know if there is something important missing that can be added or other information that is would not be useful at all.
Can you help me please in this task?
| Title 1 |
Index |
Model 1 |
Model 2 |
Model 3 |
Model 4 |
Model 5 |
Model 6 |
Model 7 |
Model 8 |
| Model Tests |
LR X2 |
data |
data |
data |
data |
data |
data |
data |
0.644 |
|
d.f. |
data |
data |
data |
data |
data |
data |
data |
16 |
|
Score X2 |
data |
data |
data |
data |
data |
data |
data |
770.24 |
| Discrimination Indexes |
R2 |
data |
data |
data |
data |
data |
data |
data |
0.644 |
|
Dxy |
data |
data |
data |
data |
data |
data |
data |
-0.744 |
|
R216,501 |
data |
data |
data |
data |
data |
data |
data |
0.738 |
| Accuracy |
Concordance |
data |
data |
data |
data |
data |
data |
data |
0.872 |
|
AIC |
data |
data |
data |
data |
data |
data |
data |
5317 |
|
AIC X2 scale |
data |
data |
data |
data |
data |
data |
data |
660 |
|
data |
data |
data |
data |
data |
data |
data |
data |
data |
| Validation * |
LR R2 |
data |
data |
data |
data |
data |
data |
data |
0.621 |
|
Dxy |
data |
data |
data |
data |
data |
data |
data |
-0.734 |
|
Slope |
data |
data |
data |
data |
data |
data |
data |
0.938 |
Thank you!
Marc
1 Like
That looks pretty good, but don’t forget the most important thing: re-sampling-based smooth nonparametric calibration curve plots.
1 Like
Thank you so much for your help,
do you mean to add the plots of the calibration procedure shown in 21.5 of Regression modeling strategies https://hbiostat.org/rmsc/coxcase.html#validating-the-model?
Thank you!
Marc
Yes, the approach that does not use stratified K-M estimates.
1 Like
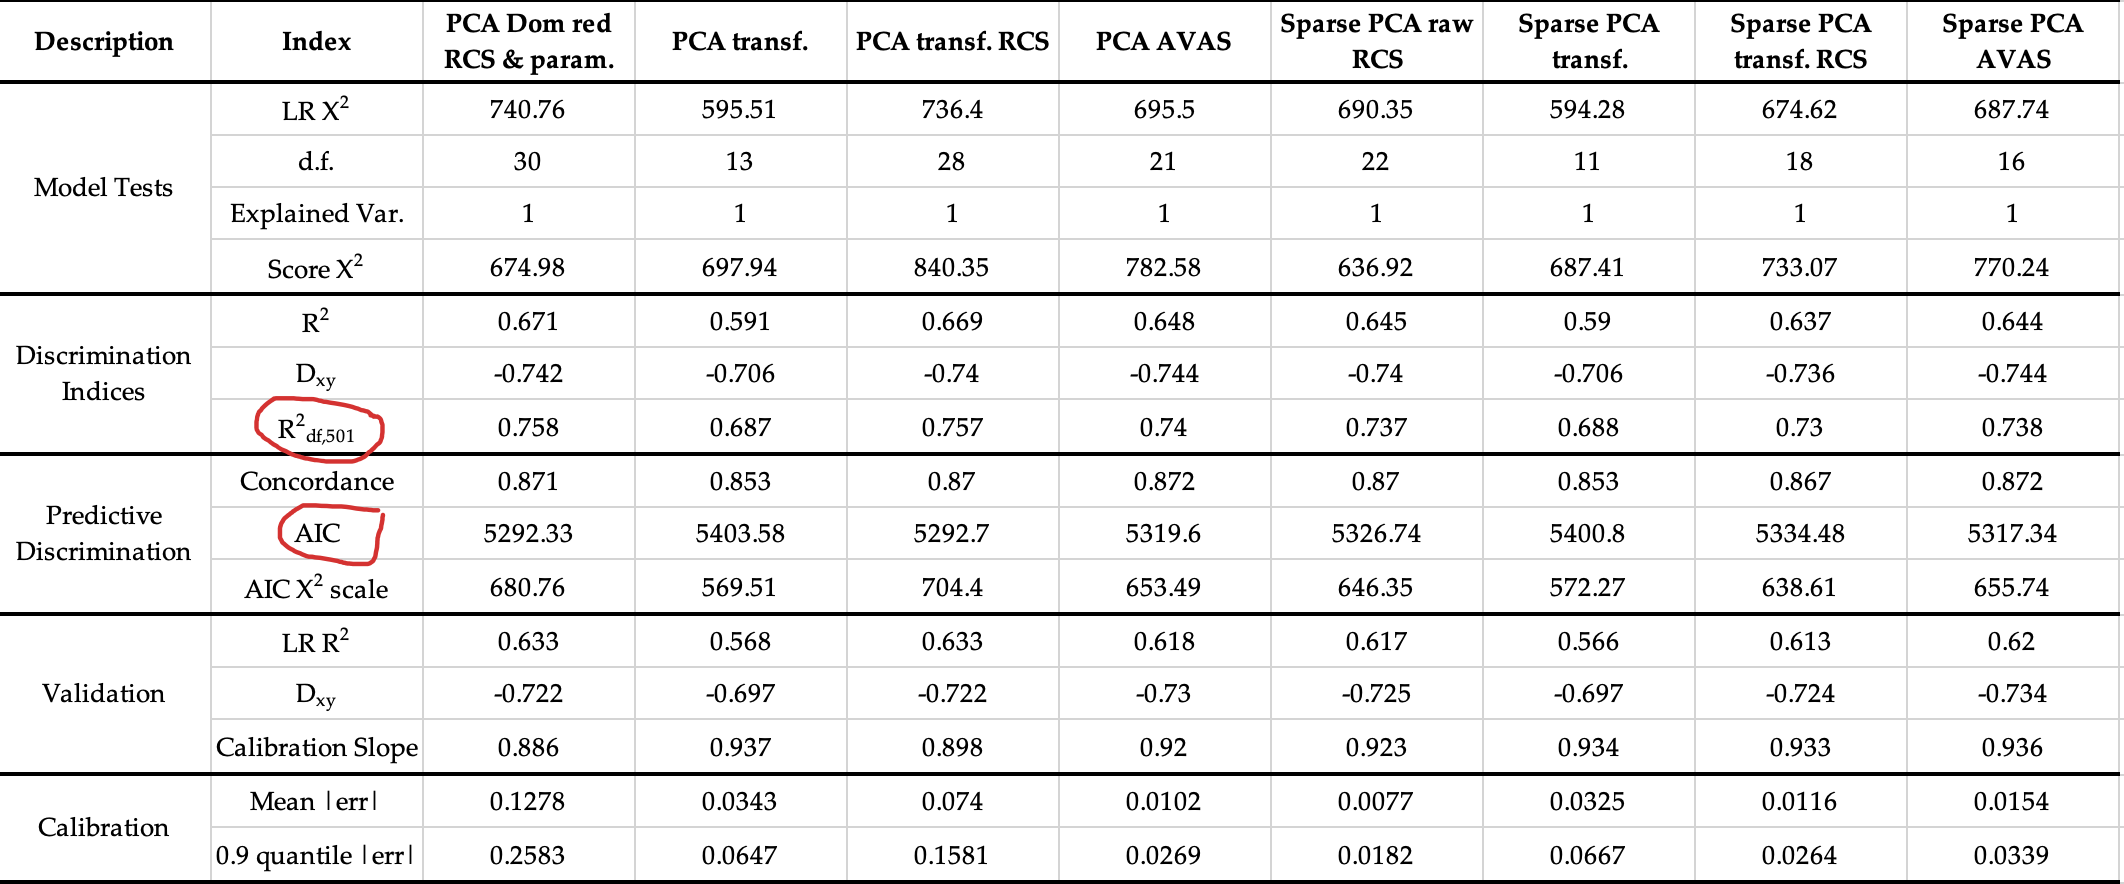
Dear professor, I have already fitted my ‘best’ Cox PHM models following different procedures and I have tabulated them with the important information and indices. Now, my task is to reccomend which one could deserve our attention. I think that the ‘best’ one may be the Sparse PCA AVAS transformed, but I am not sure, because variable transformation include uncertainties. Maybe it could be better to work further on Sparse PCA raw RCS…
Which indices do you think that should be evaluated in order of its importance for the model?
Another question I have is that I don’t know how to interpret the results of Score X2 and its relationship with LR X2. In some cases both are close and in others they differ so much. Could you please indicate what is the correct interpretation of this relationship between these indices?
Thank you so much!
Marc
1 Like
Extremely nice table. Regarding transformations when PCA/SPCA is being used, these transformations should be unsupervised learning-based a la nonlinear PCs. Then you don’t need to penalize for transformation uncertainty. And you might consider adding AIC and the newer adjusted R^2 that uses the effective sample size (number of events) and subtracts p from \chi^2 except when doing validation samples. In place of “Accuracy” I would call that Predictive Discrimination.
1 Like
HI professor, many thanks for your valuable comments. Regarding the info to add, I think that it’s already included in the table:
AIC (located in prediction ability) and Rdf,501 . 666 is the sample size and 501 the effective sample size (number of events). Is there any other AIC measure to compute or include?
I have additional questions which I would be very grateful if you could help me:
1.- I don’t know how to interpret the results of Score X2 and its relationship with LR X2. In some cases both are close and in others they differ so much. Could you please indicate what is the correct interpretation of this relationship between these indices?
2.- Which model/s do you think that deserve our attention. I think that the ‘best’ one may be the Sparse PCA AVAS transformed, but I am not sure. Maybe it could be better to work further on Sparse PCA raw RCS… Any thoughts about the model comparison?
Thank you again for your kind help!
Sorry I missed that re:AIC. Drop the score and its p-value entirely. This is only for when it’s computationally too expensive to compute the LR \chi^2.
AIC is what I would emphasize the most, followed by adjusted R^2. As far as transformations are concerned, just make sure that any transformation that was derived by looking at relationships with Y have all the d.f. accounted for that way.
1 Like