Hey there,
I have very fresh data from my research project, where I have encountered a very exciting phenomenon.
In the following, I have plotted the survival curves (Kaplan-Meier curves), dividing my target variable values into tertiles.
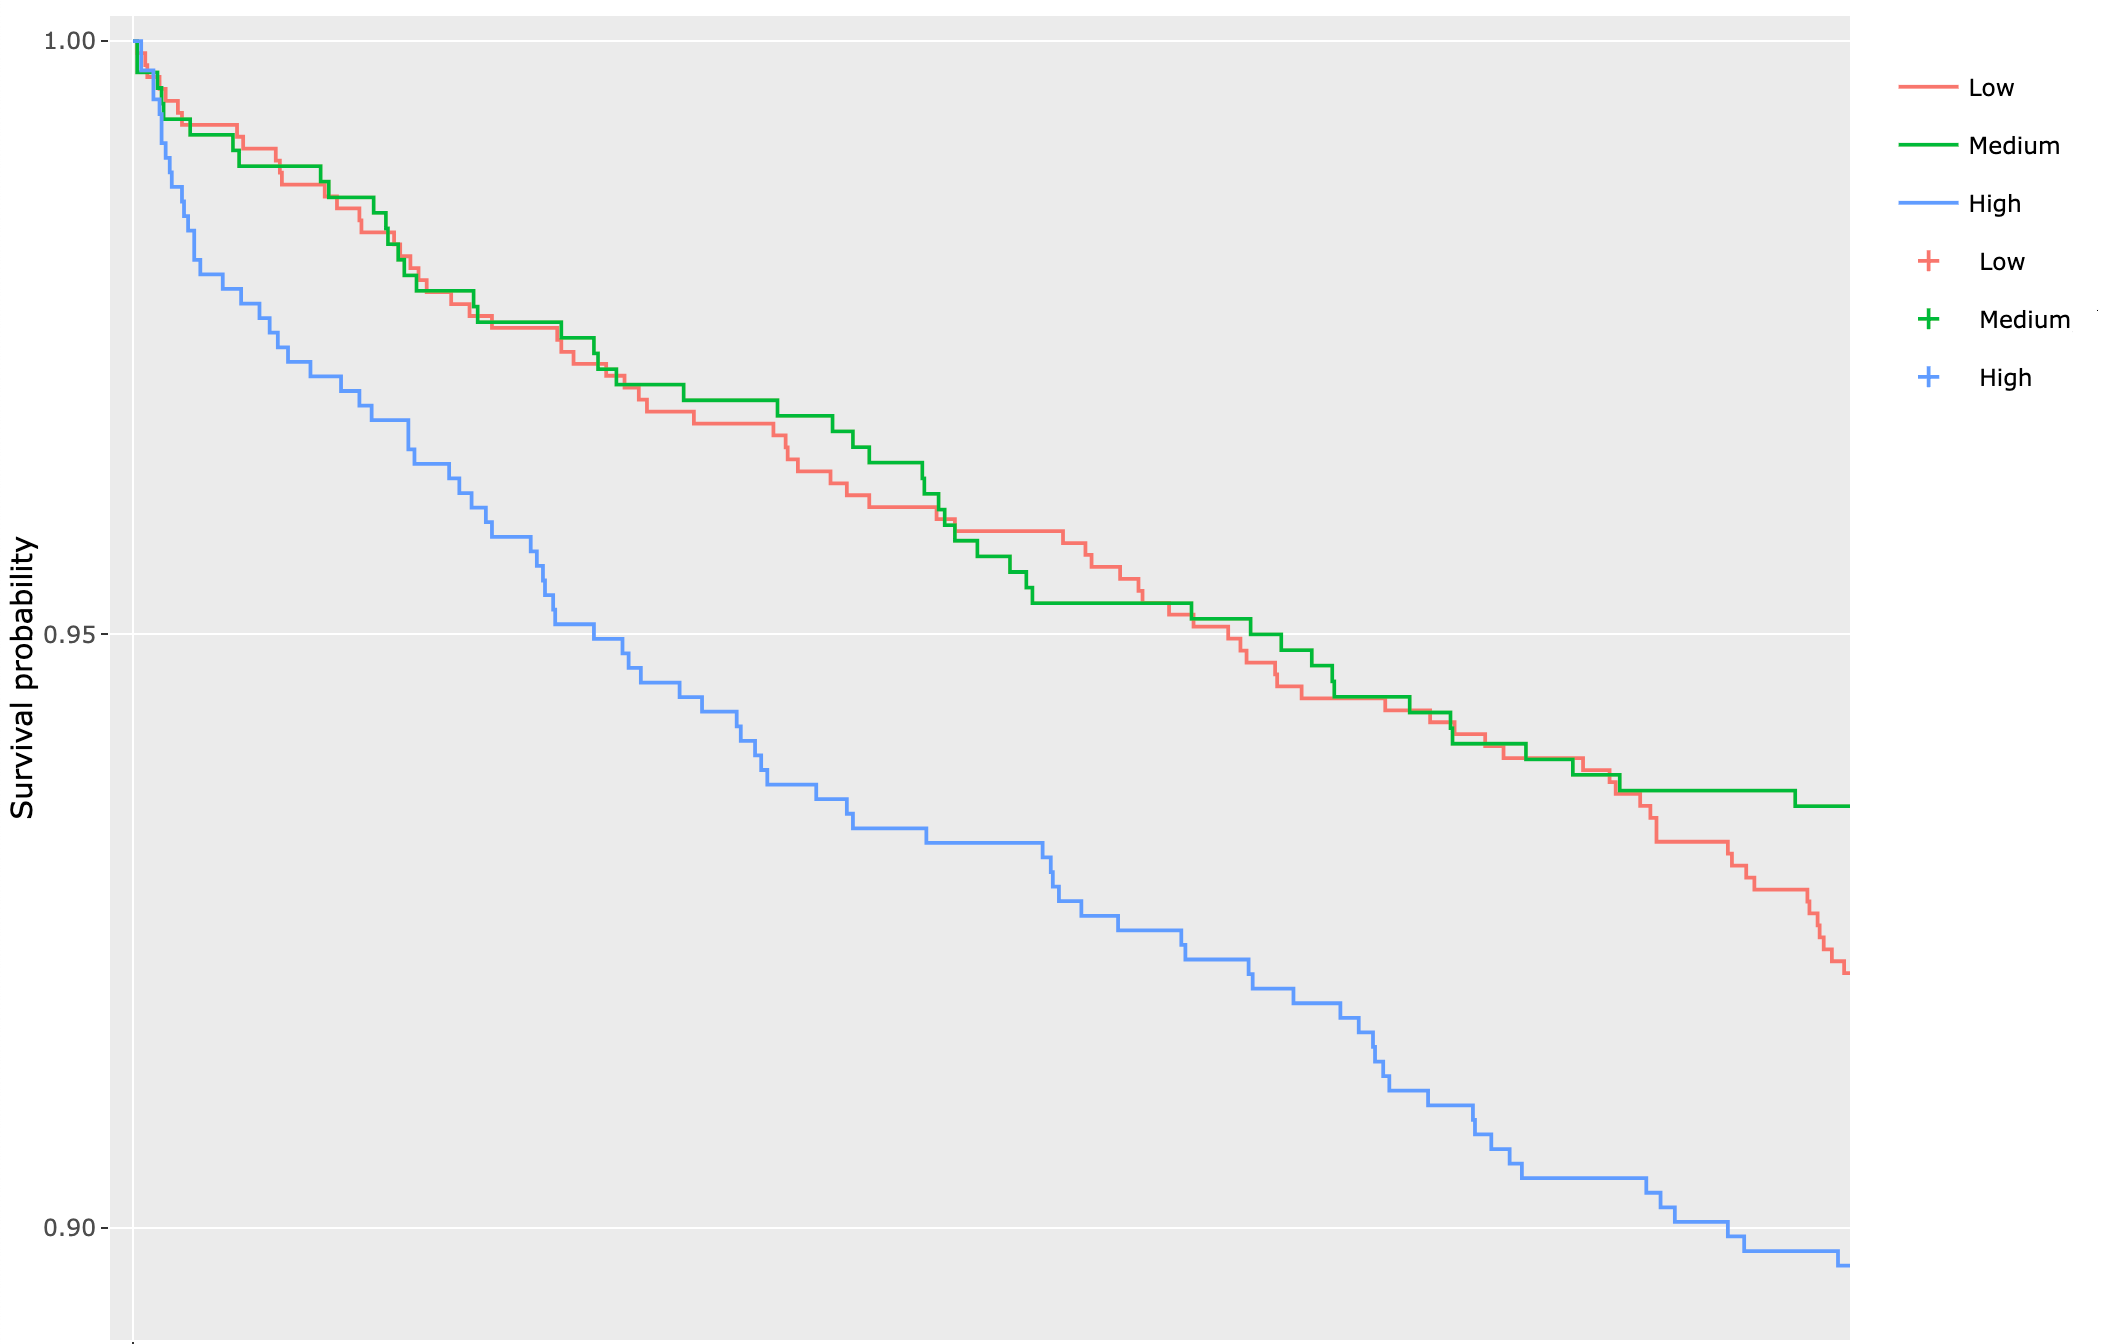
As you can easily see, the effect in the top tertile is visible compared to the two other tertiles, while the bottom and middle tertiles do not differ that much.
If I now calculate a multivariable Cox regression and use my target variable as continuous, I get no visible (or stat. significant) effect. I hope I am right when I explain this by the fact that there are no differences in the lower and middle tertile and therefore there is no effect in one direction.
Now I have thought about including my target variable as a categorized-tertile-variable in the multivariable Cox model. This way I would see exactly the effect of the survival curves.
BUT so far my guiding principle, which I have read extremely often, has been that you should partouly not categorize continuous variables.
So what can I do here alternatively to prove the effect not only by showing survival curves?
Or am I mistaken here and the effect may well not be “detectable”? (my event number should actually be enough)
Many thanks already for any help and support.