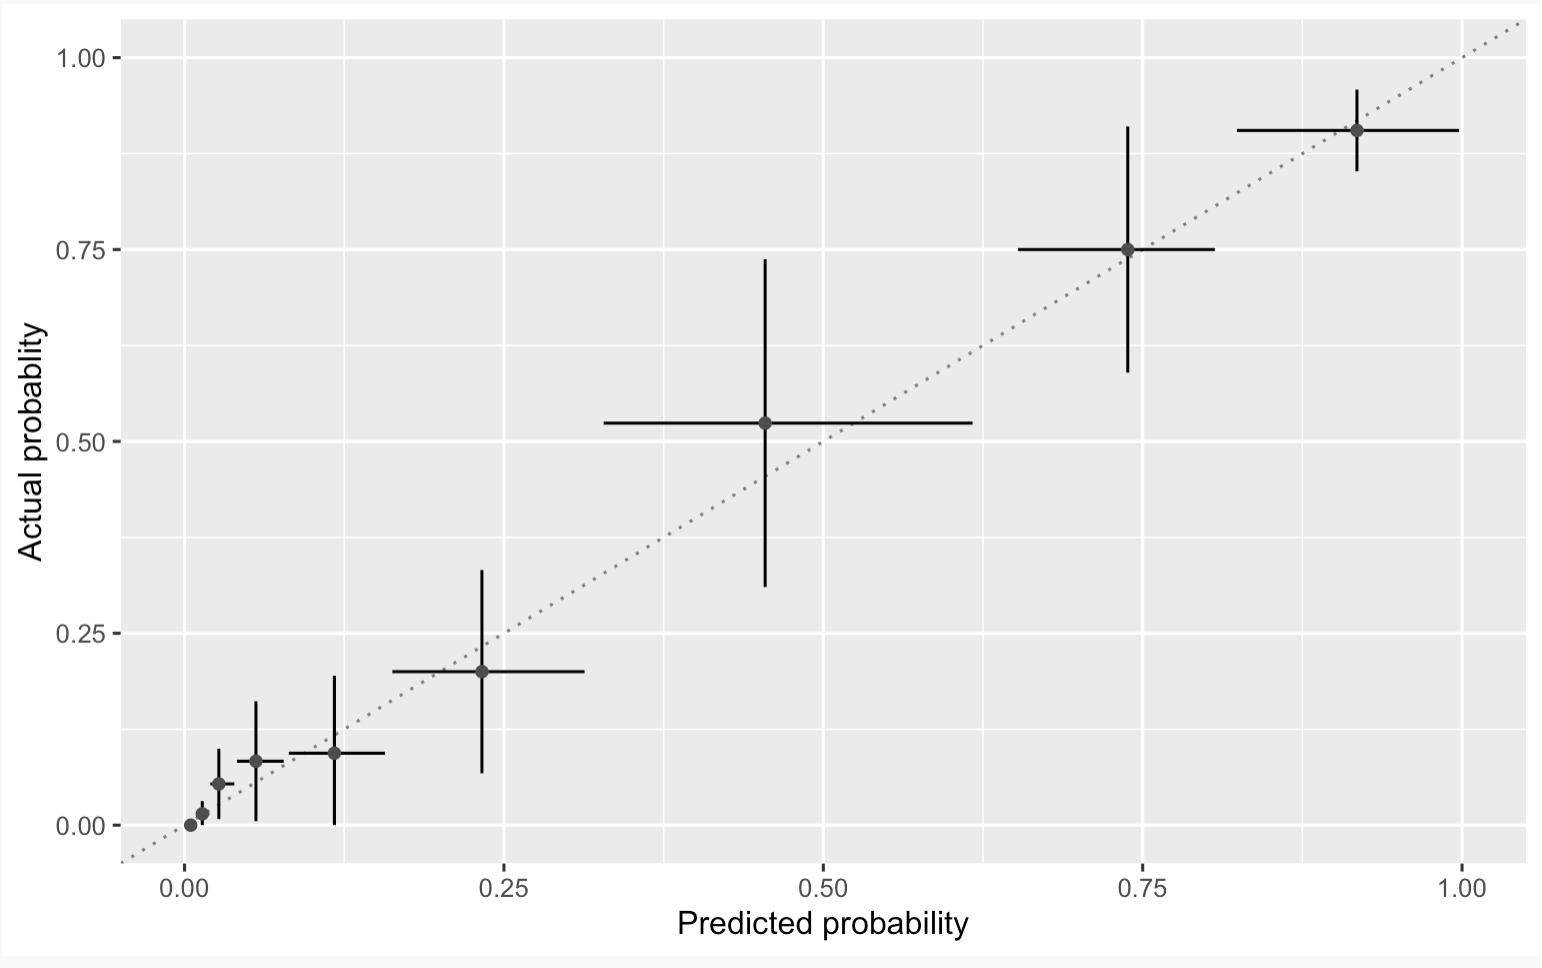
I most often observe calibration plots like plot A:
PLOT A
Where the lines represent 95%CIs.
However, intuitively, I’m more comfortable with plot B where the CIs of the predicted are presented as well?
PLOTB
Is there a good reason for not using the form in PLOT B in preference to A?
2 Likes
We don’t usually due plot B just because of laziness.
But neither of these are really calibration plots. Calibration plots are high-resolution minimal-assumption representations of predicted vs. actual. This needs to be done using nonparametric smoothers, splines, etc., Arbitrary binning makes plots potentially misleading. But with the smooth approach we don’t know how to display uncertainty in the x.
2 Likes
Re “arbitrary binning,” perhaps we should do multiple calibration plots with varying number of bins, and eyeball the consistency (or lack of it) across the various choices. Most of the advice I’ve seen recently on Hosmer-Lemeshow seem to suggest it’s more suitable as a soft eyeball diagnostic than a formal hard test. (Or more precisely, that’s been my interpretation.)
The recent US News Best Hospitals analysis apparently used bootstrapping of H-L stats on small subsamples to overcome the problem that H-L is almost always significant, if the sample size is large enough. As far as I can tell, they didn’t cite a source for that idea, so the RTI team on the project may have cooked that idea up themselves.
Do you all think that’s a worthwhile step forward for calibration assessment?
Ignoring calibration because our measurements/tests are fuzzy doesn’t seem like a good approach. We’re kinda between a wet squishy place and a swamp on this.
As I explained in my Regression Modeling Strategies book and course notes, the H-L test is obsolete. The adaptation of it you described is invalid. The US News group that did mortality modeling did not want to produce any calibration curves, hence their fallback to an obsolete method. Calibration curves work for small and large sample sizes (especially large ones).
I can’t see spending the time to do multiple analyses using a non-competitive approach, and instead recommend that a solid, non-arbitrary, smooth approach be used.
1 Like