Trying to understand statistical methods through the lens of replication

David Spiegelhalter (2019) suggested in his recent book that learning from data is a bit of a mess and that confidence intervals have baffled generations of students. The definition of a P-value being the probability of an observed value or some other more extreme hypothetical values conditional on another single hypothetical value convinces many that statistics is impossible to truly understand. However, all students understand the idea of someone else replicating or confirming their own observations in clinics and labs and the probability or expected frequency of this happening.

I show in my revised preprint (https://arxiv.org/pdf/2512.13763) that if a second study has an infinite sample size, then the probability of replicating the first study result with the same sign difference is numerically equal to one minus the one-sided P value (e.g. 1-0.025 = 0.975). If we wish the replicating study to be 1.96 SEM greater than the minimum same sign (to get a P value of 0.025 one sided again) the probability of this happening is 0.5. However, if the replicating study is the same size as the original study, then the probability of getting P ≤ 0.025 is only 0.283 and the probability of a same sign result is 0.917 as shown by Killeen (2005).

In this pre-print, I use mathematical notation instead of Excel notation. I make familiar assumptions such as a study was done perfectly with no bias etc, that unconditional prior probabilities are uniform for the scale of possible true values and possible sample values and that the probability of replication should be calculated by adding variances.

Figure 1.

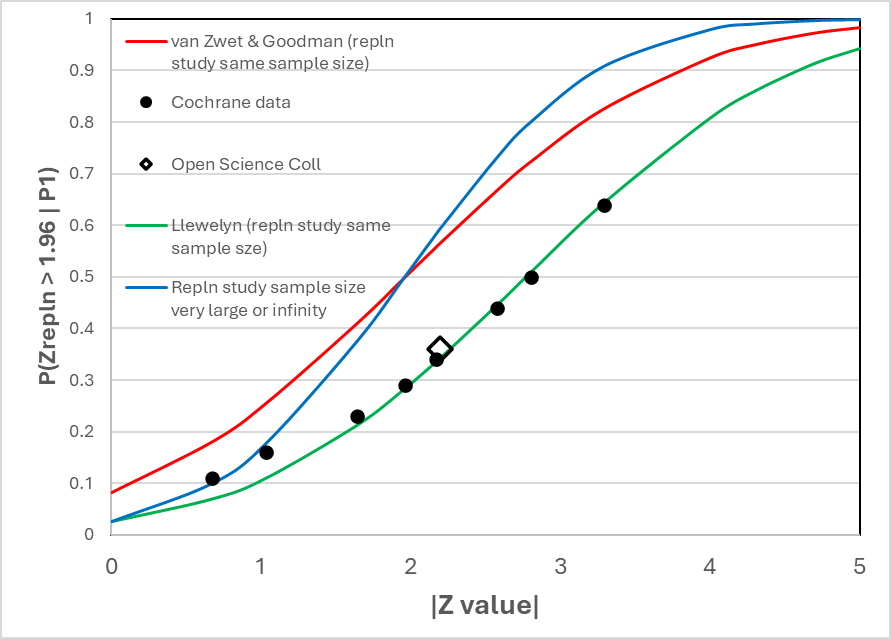
Figure 1 shows the correspondence between the frequency of replication with a P value of 0.05 two-sided (or 0.025 one-sided) estimated by van Zwet and Goodman (2022) from the Cochrane data base (represented by solid black round symbols) and various replication models (continuous lines of various colours). The result of the Open Science Collaboration is represented by the black rimmed diamond symbol.

The green line represents the expected frequency of replication using my model based on the replication study being of the same size as the original study. They correspond closely with the Cochrane and Open Science frequencies.

The red line is when the van Zwet expression (https://discourse.datamethods.org/t/some-thoughts-on-uniform-prior-probabilities-when-estimating-p-values-and-confidence-intervals/7508/310?u=huwllewelyn ) is applied to a replication study of the same sample size. It does not correspond to the Cochrane data as pointed out already by van Zwet and Goodman in their 2022 paper. Below a Z value of 1.96, when the replicating study sample size is modest and the same as in the original study (red line), the probability of replication is higher than when the replicating sample size is infinitely large (blue line), suggesting that there is a problem with their expression.

The blue line corresponds to my model when the replicating study’s sample size is infinitely large. It also corresponds to the result of applying the model and expression used by van Zwet if the sample size of the replicating study is infinitely large. Both expressions give the same result.

It appears that the assumptions made above for my expression, including an assumption of little bias, are reasonable for the RCTs in the Cochrane data base and also for the Open Science study. However, if there is a suspicion that any of the assumptions are invalid for some study, then the study result could be rejected or an attempt at correction could be made by using Bayesian methods.

An interesting situation arises with respect to the demand for two study results with P values of ≤ 0.05 two-sided or ≤ 0.025 one-sided. Figure 1 shows the probability of getting such a second significant result conditional on the same sample size and the first P value. Thus, if the first P value is 0.025 one-sided, the probability of a second study of the same size getting a significant result is only 0.283.

In order to get a 80% chance of getting a significant result again when P = 0.025, we would need a second sample size of just over 4 times the first. Similarly, if 4 separate studies of the same size were done, there is a probability of 0.28 of getting a significant result after the 1st study, 0.5 after the 2nd study, 0.67 after the 3rd study and 0.79 after the 4th study. This only applies on average before any repeat studies are done. However, if we combined results cumulatively, then the probability of replication will change as more data comes in.

References

Spiegelhalter, D. The Art of Statistics: Learning from Data. Penguin Random House, 2019.

van Zwet EW, Goodman SN. How large should the next study be? Predictive power and sample size requirements for replication studies. Statistics in Medicine. 2022; 41(16): 3090–3101. doi:10.1002/sim.9406.

Killeen PR. An alternative to null-hypothesis significance tests. Psychological Science. 2005; 16:345–353.

This is a wonderful quote because of its perceptive double use of “hypothetical”. I hadn’t stopped to think of the first hypothetical. It’s important because the sampling distribution is a true hypothetical thought experiment that depends on (often unknown) intentions of the experimenter (such as timing and number of data looks).

There is a rich literature on calculating replication probabilities from initial p-values. Consider adding several references to your top post.

I’ll leave it to other to comment on your calculations. I’m not tempted to because I’m not that interested in replication probabilities and only care about the probability that the treatment works given whatever we currently know.

1 Like

It’s disappointing to see that you are still making the same mistake which we pointed out to you several months ago. In Appendix 1 on p23 (3rd line from below) you define the z-statistic of the replication study as

z_\text{repl} = b_\text{repl} / \sqrt{v_1+v_2}

where \sqrt{v_1} is the standard error from the first study and \sqrt{v_2} is the standard error from the replication study. This is a mistake because z_\text{repl} doesn’t have the standard normal distribution under the null hypothesis of no treatment effect. In other words, it’s not a proper z-statistic. The z-statistic of the replication study should simply be defined as the estimate divided by its standard error

z_\text{repl} = b_\text{repl} / \sqrt{v_2}.

If you do that, and assume the uniform prior for the true effect, then you should get the same result as Goodman (1992).

I will not get into another endless debate about this, so I won’t comment any further.

4 Likes

Editorial note: Erik has stated the problem extremely clearly here and on another thread, so we won’t be debating the replication probability formula again here.

3 Likes

This is of course my main objective too, estimating the probability that the treatment works if we were to repeat the study impeccably with infinitely large sample sizes. Under these conditions, the probability of ‘replication’ by the treatment again to be barely working or clearly better (i.e. barely or clearly better than placebo) is arithmetically equal to 1 - P. (Erik’s expression and mine give the same result in this regard.) The probable impeccability of the study is estimated by considering a list of potential flaws and hopefully finding evidence that each of such flaws is improbable (i.e. by using a probability version of the disjunctive syllogism). Mayo calls this severe testing. If all the rival possibilities are of low probability (including of non-replication) then in the absence of something not considered, we could assume that the treatment probably works. However, if this severe testing fails because of evidence of biases etc., then one can turn to Bayesian modelling to assess what would happen without the flaws. I outline this in the discussion of the paper.

By the way, in case I am accused of misquoting David Spiegelhalter, I should point that the view about P values and hypotheses was not his but mine!

Here is a more comprehensive list of potential references to the literature on replication as you suggest. Is there anything important missing?

Goodman, S. N. (1992). A comment on replication, p-values and evidence. Statistics in Medicine, 11(7), 875–879. https://doi.org/10.1002/sim.4780110705

Killeen PR. (2005) An alternative to null-hypothesis significance tests. Psychological Science. 2005;16:345–353.

Cumming, G. (2005). Understanding the average probability of replication: Comment on Killeen (2005). Psychological Science, 16(12), 1002–1004. https://doi.org/10.1111/j.1467-9280.2005.01650.x

Cumming, G. (2008). Replication and p intervals: p values predict the future only vaguely, but confidence intervals do much better. Perspectives on Psychological Science, 3(4), 286–300. Replication and <i>p</i> Intervals: <i>p</i> Values Predict the Future Only Vaguely, but Confidence Intervals Do Much Better

Boos, D. D., & Stefanski, L. A. (2011/2012). P-Value Precision and Reproducibility. The American Statistician, 65(4), 213–221. https://doi.org/10.1198/tas.2011.10129. Published in the 2011 issue, with the final edited form appearing in 2012.

Lazzeroni, L. C., Lu, Y., & Belitskaya-Lévy, I. (2014). P-values in genomics: apparent precision masks high uncertainty. Molecular Psychiatry, 19(12), 1336–1340. P-values in genomics: Apparent precision masks high uncertainty | Molecular Psychiatry

Halsey, L. G., Curran-Everett, D., Vowler, S. L., & Drummond, G. B. (2015). The fickle P value generates irreproducible results. Nature Methods, 12(3), 179–185. The fickle P value generates irreproducible results | Nature Methods

Vsevolozhskaya, O. A., Ruiz, G., & Zaykin, D. V. (2017). Bayesian prediction intervals for assessing P-value variability in prospective replication studies. Translational Psychiatry, 7, Article 1271. Bayesian prediction intervals for assessing P-value variability in prospective replication studies | Translational Psychiatry

Segal, B. D. (2021). Toward Replicability With Confidence Intervals for the Exceedance Probability. The American Statistician, 75(2), 128–138. https://doi.org/10.1080/00031305.2019.1678521

van Zwet, E. W., & Goodman, S. N. (2022). How large should the next study be? Predictive power and sample size requirements for replication studies. Statistics in Medicine, 41(16), 3090–3101. https://doi.org/10.1002/sim.9406

van Zwet, E., Gelman, A., Greenland, S., Imbens, G., Schwab, S., & Goodman, S. N. (2024). A New Look at P Values for Randomized Clinical Trials. NEJM Evidence, 3(1), EVIDoa2300003. https://doi.org/10.1056/EVIDoa2300003, Epub December 22, 2023.

Berrar, D. (2024). Estimating the Replication Probability of Significant Classification Benchmark Experiments. Journal of Machine Learning Research, 25(311), 1–42.

1 Like

I am not going to enter into a debate about formulae, but I would like to correct a misunderstanding in your comment about page 24 in Appendix 1 of my paper. The expression 𝑧_repl =𝑏_repl/√(𝑣1+𝑣2) was not described nor intended to be a classical z-statistic (I took on board your point about this potential source of confusion from our previous discussion). To be clear, 𝑧_repl =𝑏_repl/√(𝑣1+𝑣2) is a predictive standardisation reflecting uncertainty in both original and replicating studies conditional on the result of the original study. However, in Appendix 2 lower down on page 24 and onwards, a z-statistic and P value are used in their conventional sense to describe probabilities under a specified null hypothesis. This is distinct from the predictive framework used in the main text, where standardisation is based on the distribution of possible replication outcomes.

That’s not at all what I meant. I want to know the probability that the treatment works, period.

Replication to me is more of a diversion than a path forward.

And let’s definitely not revisit that replication z formula.

1 Like