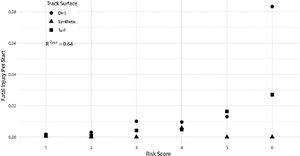
Wearable sensors are becoming popular for generating data, in horses an accelerometer attached during exercise via an AI algorithm generates an opaque “fingerprint” for each individual. Using this information which apparently creates a continuous variable researchers created a distribution of the measurements and then categorized horses into risk scores for a fatal musculoskeletal injury. I understand that categorizing a continuous predictor variable is a faux pas, but how can SD deviation make sense? If the sd is 1.9 you are in one category and 2.1 another.
From the methods: The results from this process provided a population distribution from which a mean was calculated. The resultant model could be applied to any horse and the outcome compared to the population of stakes-winning horses described herein in terms of SDs from the calculated mean. All horses in the dataset were then assigned risk scores according to the number of SDs by which their data differed from the same mean. This approach proved both accurate and helpful, particularly as all 589 starts by the non–grade 1 and 2 stakes winners fell within 2 SDs of the grade 1 and 2 stakes winners’ mean and were separated from the horses that eventually suffered a catastrophic injury, the vast majority of which had strides > 3 SDs from that mean