first time poster - primarily a clinician (medical oncologist), but pursuing a part-time PhD to develop teaching materials for clinical prediction models (CPM) for clinicians.
I am looking to review a commonly used oncology predictive tool, and in the process of reviewing the published validation/calibration papers, I am finding a reasonable number are not using true observed endpoint (death), but an endpoint estimated using kaplan-meier. I cannot find a discussion of this in the evolving literature around reporting, validating, and calibrating CPMs that addresses this approach, and while it raises a non-specific concern for me about the impact of censoring and potential introduction of bias, I am not knowledgeable enough how to delineate this concern explicitly, nor how concerned I should be. Any thoughts on this would be greatly appreciated.
I know that this post is from 2015, but the following articles are great:
-
Survival Outcomes: Assessing Performance and Clinical Usefulness in Prediction Models With Survival Outcomes: Practical Guidance for Cox Proportional Hazards Models - PubMed
-
Competing Risks: Validation of prediction models in the presence of competing risks: a guide through modern methods - PubMed
-
Counterfactual Predictions: [2304.10005] Prediction under interventions: evaluation of counterfactual performance using longitudinal observational data
One of the key concepts that I’m still trying to figure out is IPCW (Inverse Probability Censoring Weights), does anyone has a good reference?
I’m not clear on why this is a complex problem except when there are competing risks (and for that, state transition models are more logical IMHO). Kaplan-Meier estimator should play no role here because that is for the homogeneous case where patient-specific risk factors don’t exist, e.g., older patients die at the same rate as younger patients.
By complex problem do you relate to validation of prediction model with time-to-event outcome or just IPCW?
Maybe I missed something. Censoring gets interesting/challenging when it’s not random (KM and Cox assume random censoring), and for that case you might attempt to get debiased estimators by forms of inverse probability weighting.
If I understand correctly Uno’s article on his version of c-index for time-to-event outcomes suggests the KM estimator for IPCW:
Sounds reasonable to me, yet - it’s not weird to use variables in order to produce performance metrics?
I didn’t see something similar while dealing with performance metrics for binary outcomes (Calibration, Discrimination or Clinical Utility). There is something “clean” about using performance metrics that are agnostic to the original variables that were used for the development of the model (such as your original version of c-index).
I’m motivated to find a common language that might encourage me (and my colleagues) to avoid information loss in the context of performance metrics. Even if the model was trained only on a binary outcome it might be useful to use your version of the c-index because there are more usable pairs (event ↔ event and sometime censored-event ↔ event).
The simplest and and most general-purpose performance measure of predictive discrimination is the new adjusted pseudo R^2 discussed here and implemented in the R rms package. This works any time you have a log-likelihood function and can compute the effective sample size, and corrects for overfitting. Pseudo R^2 handle censoring quite well. Of the four measures at the bottom of that web page I like R^{2}_{p,m} the best. In OLS this is almost exactly R^{2}_\text{adj}.
That’s great, thanks!
More questions/points ![]() :
:
-
Some algorithms do not have a log-likelihood function, what about them?
-
I can’t interpret anything with “log” or “exp”, that’s why I’m not a big fan of Nagelkerke version of R^2 even though it is a proper scoring rule. I’m a fan of the c-index because I can tell a story that relates to the number, I use the c-index as a tool for exploration. For choosing candidate models I use Lift Curve for Resource Constraint, NB for treatment harm and Ralized NB for combination of the two.
-
Why would you consider R^2 measures as a type of Discrimination? Brier Score is considered to be “overall performance measure” because it captures both Calibration and Discrimination and the same is true for R^2. Maybe we should have a separate subcategory for Explained Variation?
Some good points. I greatly prefer methods that have likelihoods. That way you can move between Bayesian and frequentist attacks on the problem and can handle more types of censoring elegantly. Lift curves are highly useful and work for most settings. R^2 captures both discrimination and calibration, but unlike the Brier score greatly emphasizes discrimination.
Too learn how to better interpret pseudo R^2 we need a compendium of examples where it is compared to the c-index and other measures. It’s worth the trouble because likelihood-based methods are the most efficient/least noisy.
I tend to equate explained variation with discrimination but I’ll bet there are formal definitions that would help us.
Just to illustrate my point:
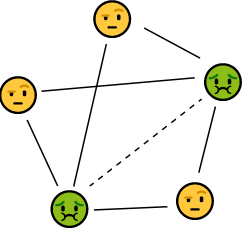
![]() : Event
: Event
![]() : Non-Event
: Non-Event
The binary c-index compares only the couples with the full lines while the time-to-event c-index compares also the additional dashed line. I think that many times comparing between events is more important than comparing between events and non-events, especially when we are considering prioritization for screening, MRI etc.