I got an interesting question in a meeting, namely that the c-index of 0.85 “looks” too high given that there is no clear separation in the data. I gave the usual answer of “discrimination only evaluates the relative ranking of risks across all pairs”, “we should really be using proper scoring rules and calibration plots”), etc but left a bit unsatisfied.
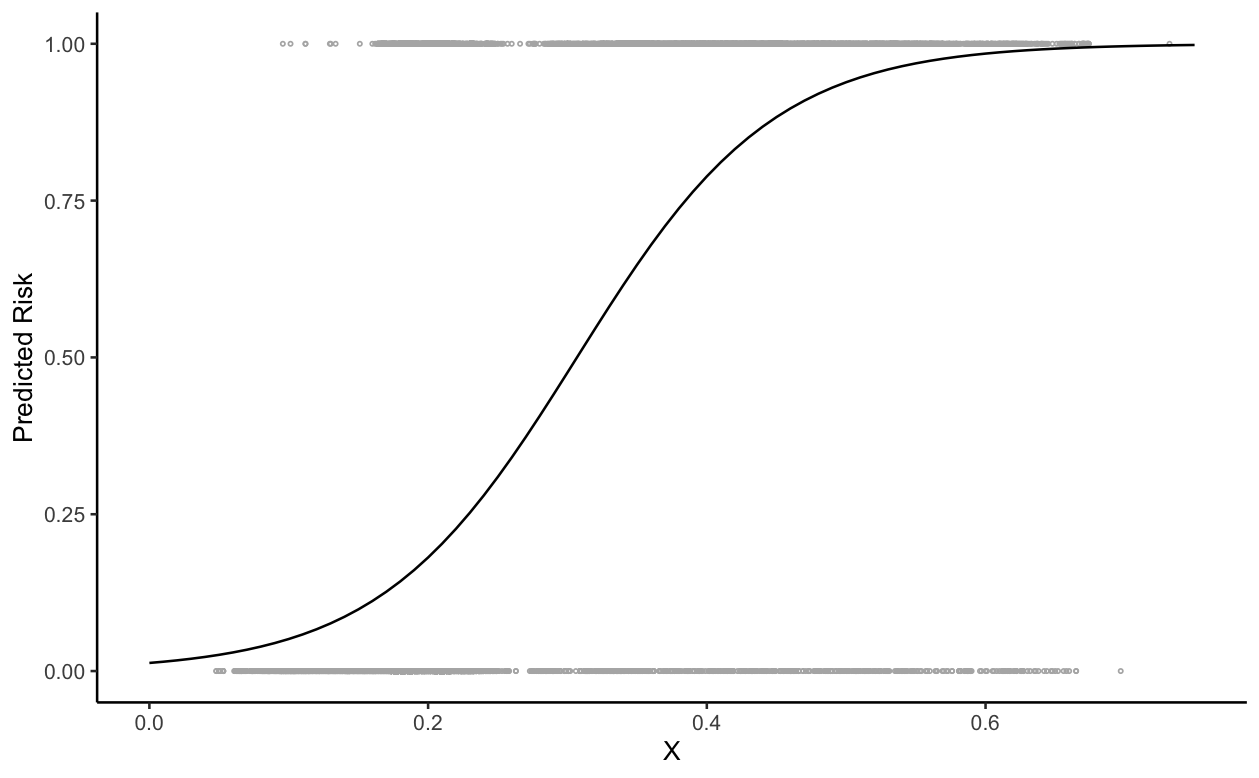
I am curious why exactly we can get a relatively high c-index even when the risk distribution for the positive and negative cases “looks” like it has substantial overlap. Additionally, I’ve never met anyone who can look at a fitted logistic model and visually identify the c-index (outside of near complete separation) though maybe I’m not well traveled enough. Where might our visual intuition break down?
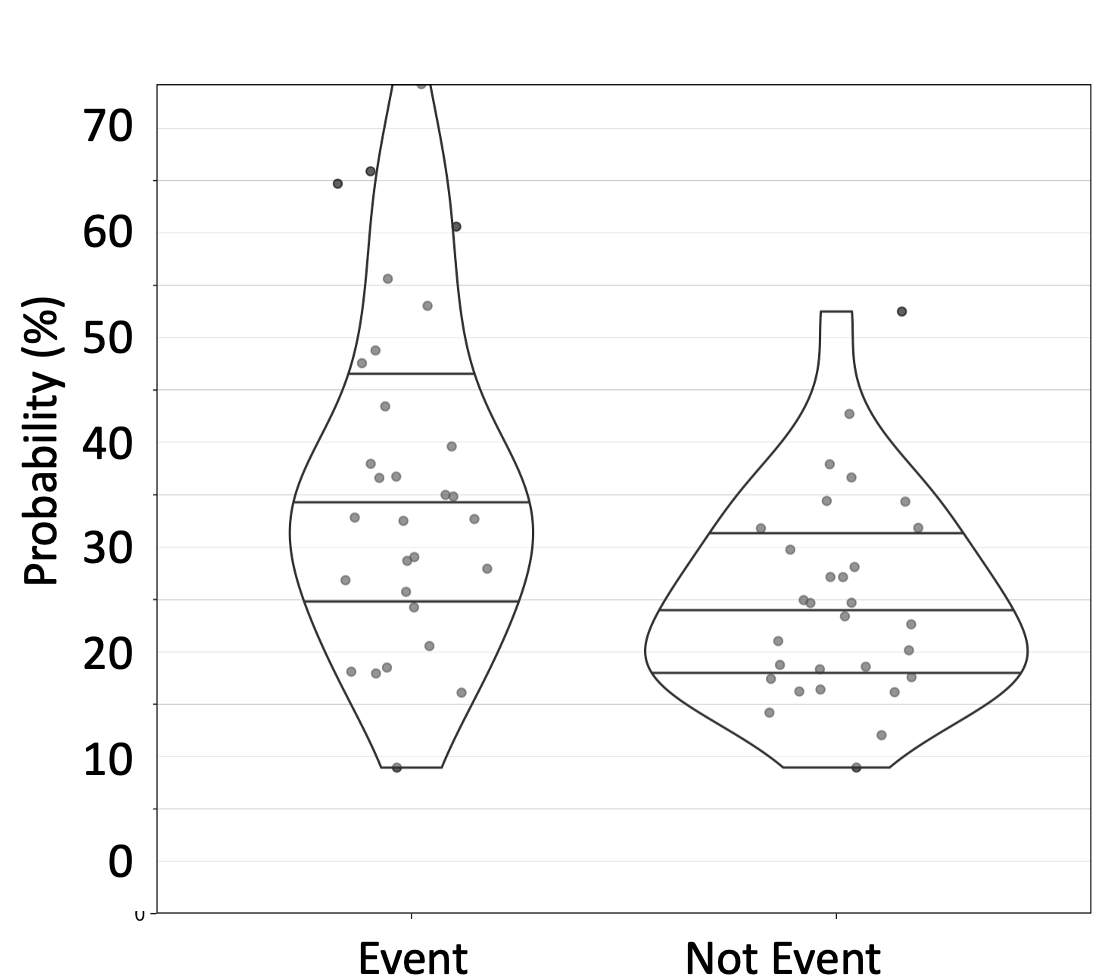
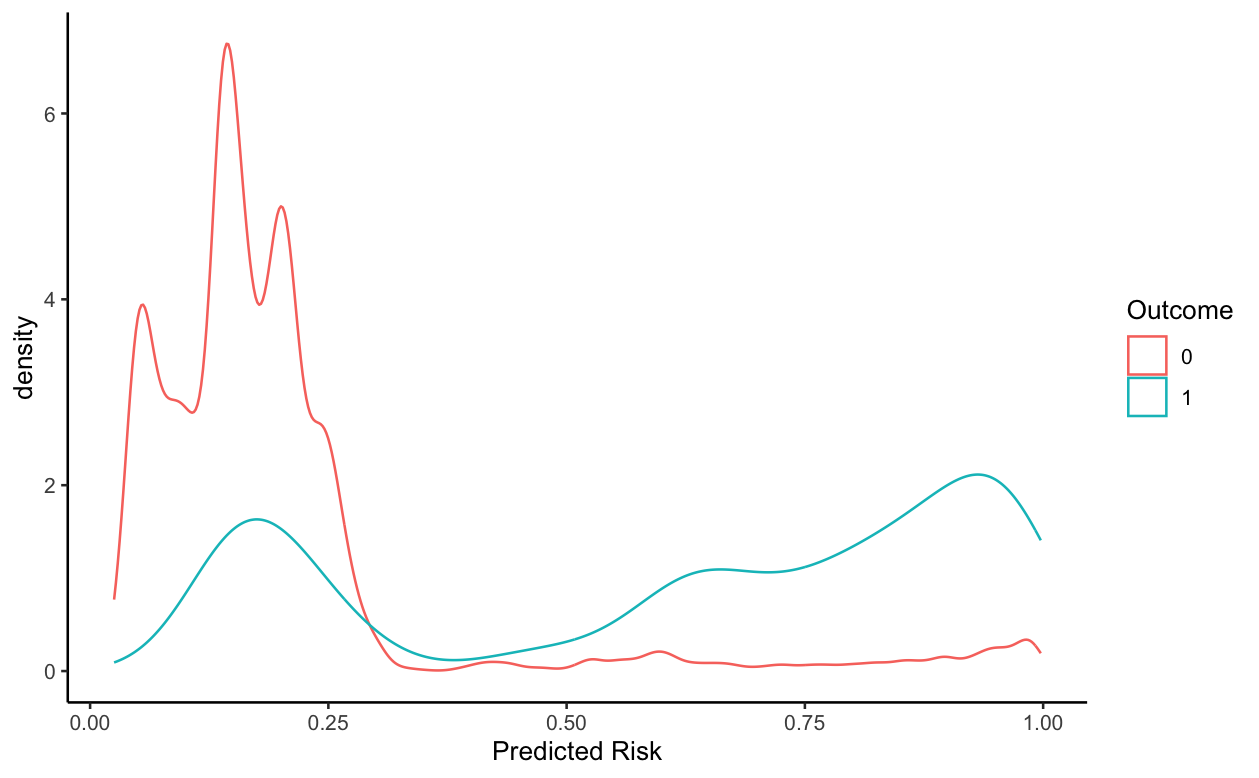
I think the plot is fooling people. I expect that the distributions are skewed (differently for those with and without the event). If I wanted to show the actual data I would do something like the attached.
The violin plots and jittered raw data points are step better than having points run into each other on a line. But IMHO better than this is back-to-back spike histograms, which scale to any sample size. See here.
As to the second part of my question, it was mostly motivated by the fact that for a continuous outcome Y plotting the fitted regression line against the raw (or validation) data will IMO generally lead to readers being able to intuit what the R^2 or MSE will be, at least in a general “better” or “worse” sense. I am trying to figure out why the same visual setup doesn’t work well for the binary discrimination case.
Use a 101-bin spike histogram instead. It will be guaranteed to reflect the raw disk distribution whereas smooth density estimates may smooth too much.