A question that has been bouncing around my head for a while concerning the vaunted “clinical cutoff” vs. risk-prediction via forward probabilities.
For this question I’m assuming that, for the hypothetical risk prediction, a statistical model development has been completed and a well-validated model exists. It has been published in Nature and approved by Dr. Harrell, Dr. Collins, Dr. Steyerberg, etc.
I’m more concerned with methods for performing the arithmetic to apply predictions in real practice settings: nomogram, phone app, integration into EMR, etc.
I wonder if the search for cutoffs and “hard and fast rules” for clinical decisions is driven partially by the technology involved in the execution of predictions at the decision-making level. Was there a golden-age of clinical prediction when practitioners used nomograms on a regular basis, or have they always just updated their knowledge with conferences, scanning the top journals in their field, and gaining clinical intuition?
I wonder if we are in this weird in-between place where nomograms are considering old-fashioned, clinical prediction phone apps are too much work/clunky when you have 15 other patients to see in the ER, and the interface between EMR and well-validated prediction models just isn’t there on a technical/programming level. Stated differently, should we allocate some of our energy to program smoother interfaces between the validated models we already have and clinical EMR systems? Or is this a need I’ve just imagined? Are practitioners already using these tools regularly from the top research hospitals to small-town community hospitals?
And, a completely ignorant and not smart-ass (I promise) question: in a context where EMR integration hasn’t been achieved, is using a nomogram derived from a well-validated model so much more difficult to use than a “hard and fast rule” within the context of real practice to justify the loss of statistical precision and integration of patient/clinician risk?
Please edit your text to clarify one thing: a nomogram is a graphical device to do arithmetic, including representation of a fitted statistical model. The rest of the process is just called statistical model development.
Good suggestion. I edited the text above to clarify that, in this hypothetical situation, I was assuming the statistical model development was already completed.
I have no meaningful answers to your questions, but do have some experience of the implementation of a breast cancer prognosis/treatment benefit prediction model in practice.
PREDICT (avaialble at https://breast.predict.nhs.uk/) is a web-based tool (so the inpute data have to be entered) that also works as a 'phone app. Since its release in 2011 there have been over 1.3 million web-sessions so it is very widely used (but not a nomogram). It seems that clinicians like the fairly simple interface and the option for the outputs (predictions) to be presented in different formats.
It is an interesting question whether to tool would be used more if it were programmed into an EMR system, but I guess that expertise and resource to carry out such programming is rarely available. It would also depend on the point in the patient clinical journey that such a tool as being used.
What a great question. I have been involved with implementation/translational studies of risk prediction/stratification tools in the ED. Our experience is that many academics think that for a tool to be translated into practice all that has to happen is for it to be published in a “big” journal & a suitable calculator put on MDCalc & “hey presto” physicians will take it up en masse. Far from it - the translation process takes longer and a whole new set of skills compared to the model development process.
Everyone in the ER - physicians, nurses, management, associated labs, IT etc needs to be part of the process and to own it for themselves. We found that getting everyone into a room, presenting the evidence for change, and allowing people to air their concerns before even a decision to implement was made, was an important first step. At that meeting if there is a desire to proceed, local champions (clinical leads, IT leads etc) must be identified and the beginning of a local implementation strategy started.
Any tool must be integrated into the current structure with clarity of purpose. Training must take place. Pragmatism must allow for local modifications & for physicians to be able to decide not to use a tool should they so desire. This can be very frustrating where evidence shows that gestalt is worse than an algorithm - however, attempts to “force” an algorithm on everyone are doomed to fail. Measurement of performance should take place recognising that there may be some downsides (perhaps the better predictions are at the cost of longer ER stays).
I’ve gone on a bit, but hopefully you’ve got the picture. Constructing a prediction tool is < half the battle.
Another perspective on the problem is that prediction models can be used in at least two major ways:
as standalone inputs to formal decisions (e.g., convolving absolute risk estimates with a utility function and solve for the decision that maximizes expected utility) or to a less formal process that uses the physician’s internal notion of a utility/loss/cost function
as summary measures that reduce many inputs into a single dimension
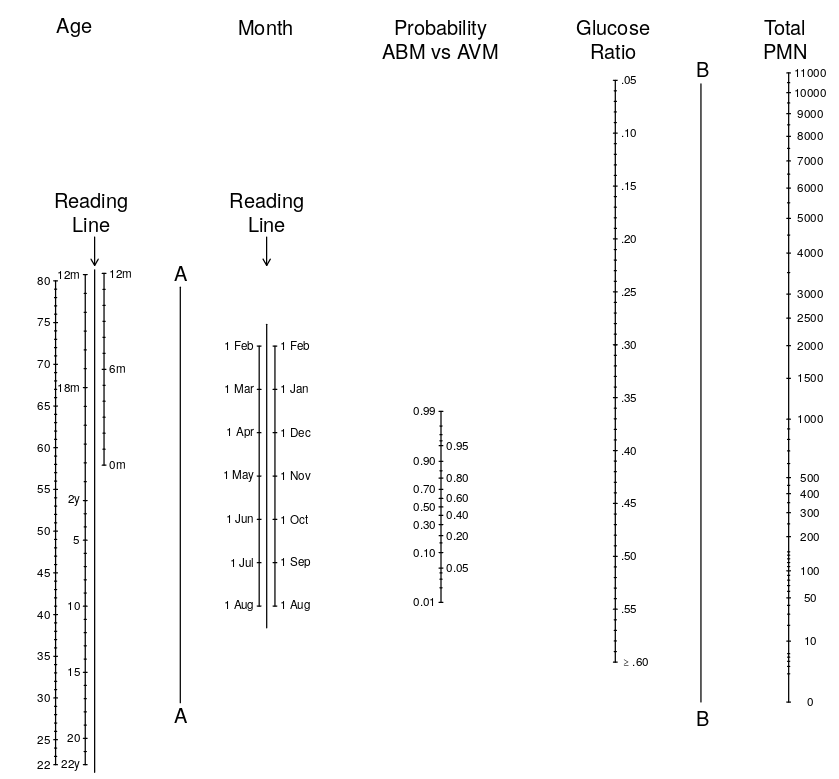
Can meaningful use be made of such a parameter, based as it is on an arcane formula and using such disparate data as CSF chemistry and the month of the year? We suggest it can. The combination of four separate pieces of data that taken singly are of marginal value provides an excellent predictive test. The parameter pABM should best be regarded as one of many pieces of evidence to be factored into the assessment of an individual case. A probability is only a probability, not the final answer; therefore, we advocate that pABM should be treated in the same way as a laboratory report—one piece of diagnostic information among others.
Thus pABM (probability of acute bacterial meningitis) can be treated as another lab value—one that summarizes other lab values and clinical variables using the model, representing by a nomogram:
Great contemplations! I figure there are a number of different issues here.
How valid is the prediction model for the intended setting of application? Unfortunately, predictions often are miscalibrated and need some form of updating before being valid for a specific setting.
If we had a well-calibrated model, how should we use it in clinical practice? Ideally, the risk predictions are input to shared decision making, which is the new dogma for non-acute settings I guess. Predictions can be obtained with full detail (www calculator, App, nomogram), or with some rounding (which usually gives some decrease in performance, but rather limited if done well).
I was unsure what a “hard and fast rule” is; I guess some simple scoring system with some cutoff for being high risk? Or a classification system as used by oncologists to define low, intermediate and high risk groups? That brings in cutoffs from the model developer, hopefully driven by content knowledge, but removing some freedom from the clinical setting, and further from the ideal of shared decision making.
Sometimes a compromise can be defined. For example, for the CT scanning of patients with mild head trauma, we proposed the CHIP rule, which was based on a prediction model. It was simplified to scoring minor or major risk factors. Having at least 1 major or 2 minor was the indication for CT scanning; sounds easy to me
Sometimes implementation is done without solid model development or validation. The Manchester Triage System (MTS) has widely been implemented across Europe, presumably because of great clinical need to optimize waiting times in the ER.
“I need a hard and fast rule so I know how to diagnose or treat patients. I need a hard cutoff on blood pressure, HbA1c, etc. so that I know what to do, and the fact that I either treat or not treat the patient means that I don’t want to consider a probability of disease but desire a simple classification rule.”
To be honest, from how it is often framed, I imagine practitioners in an emergency situation with no time (or lack of infrastructure) to collect all of the data on patient characteristics, so they want a quick rule that is “better than nothing”.
But, as I read more on predictive modeling and the forward probability mindset feels more natural, I realize that a univariate forward prediction model might also be applicable in this situation. It’s not ideal, but it’s better than the previously mentioned cutoff. After that, as you mentioned, the rounded risk-score might be another level towards a better modeling approach.
So, to sum up, I think I was thinking of “hard and fast rule” as (in order of ease of use):
Clinical cutoff based on backward probability (ROC Curve)
Anything based on an ROC curve is at odds with decision theory.
Rounded scores can be useful (@Ewout_Steyerberg has thought a lot about this).
Instead of univariable forward regression modeling, consider developing a best gold-standard model, then develop various approximations to it for different audiences/data availability. I discuss this in Regression Modeling Strategies.
Have you seen/read this paper by Nathaniel Phillips? I has been a white since I read it, but I think it touches on some of your questions.
Fast-and-frugal trees (FFTs) are simple algorithms that facilitate efficient and accurate decisions based on limited information. But despite their successful use in many applied domains, there is no widely available toolbox that allows anyone to easily create, visualize, and evaluate FFTs. We fill this gap by introducing the R package FFTrees. In this paper, we explain how FFTs work, introduce a new class of algorithms called fan for constructing FFTs, and provide a tutorial for using the FFTrees package. We then conduct a simulation across ten real-world datasets to test how well FFTs created by FFTrees can predict data. Simulation results show that FFTs created by FFTrees can predict data as well as popular classification algorithms such as regression and random forests, while remaining simple enough for anyone to understand and use
If there are any strong continuous predictors, a simple regression model with these predictors can sometimes beat (in terms of explained outcome variation) an entire tree that uses many categorical or binned continuous variables.