Just remember that Bayes’ rule is not needed for the diagnostic problem. And using it there doesn’t get students excited about the many great applications of Bayes where Bayes thinking is truly needed. In a prospective cohort study you can directly get the probabilities of real interest.
1 Like
I am not sure that this the right way to put it- and I’ve been thinking about it for a while now and wished I had a good answer (I don’t) but these are the lines along which I’m thinking-
Group probabilities versus individual binary fate-
it is the tension between probabilities and the fact that as an individual, you are one point in there but have no control over where you fall into that probability and the outcome for yourself is binary, not a probability. So 90% survival sounds good- but is useless for you and your family if you are in the 10% who don’t survive.
As a medic, you can home in peace and sleep well that with a survival chance of 90%, your patient most likely will be fine. As a patient, you wonder ‘what if I am in those 10%’- and I tell you, you don’t sleep fine with that. We personally have always lived by ‘hope for the best, prepare for the worst’- but this is usually not what your physician will tell you.
Slightly off topic but I am currently reading ‘Skin in the game’ - very cynical but absolutely worth reading- and it feels very much like the same situation.
Impact of outcomes
Linked to the issue of probability is the fact that we aren’t taught at medical school of the psychological impact of a severe diagnosis. My husband was diagnosed with Stage 4 Melanoma out of the blue- and I was shell-shocked to realise that what I had thought of a medical problem in fact comes with a mental burden of at least the same size. Probabilities are often about worsening of disease, progression or downright survival- and unless we get a better understanding of what this means to a person our communication will always be off.
The combination of ‘90% survival good for the group’ plus a severe underestimation of the psychological burden to the patient leads then to really poor communication results. Patient pushing physicians to give them an answer ‘how long do I have to live’. Physician evasive (patient ‘he/she got no idea’), physician giving probability (things go worse- patient ‘they haven’t done their best’, things go better ‘my doctors were wrong’ ) - our patient forums are FULL of them, none of these scenarios are good and they ultimately undermine trust.
Then, not directly to the question of how to communicate probability but building on the comments earlier on this thread- there is a lot of sloppy thinking out there which even doesn’t require advanced statistics to solve, e.g.
-
physicians giving Melanoma (sorry, that’s the disease of my interest, so therefore the examples are very loop-sided toward there ;-)) patients long-term survival data. We had over 10 approvals of new and effective Melanoma drugs since 2011- so we simply CANNOT have valid long-term OS data. 10 years OS data takes…more than 10 years to acquire.
-
just yesterday, someone was quoted the efficacy of chemotherapy in Melanoma- it doesn’t work, just like we learned in Med School ages ago- but given RECENT data- with cross-over from highly effective therapies that now make the rubbish comparator look good as they are able to salvage some.
So, in addition in how to communicate…the data has to be correct.
My knee-jerk reaction here is that this is the bread and butter of health economics, although there the focus is usually on the health system choosing between a sequence of decisions based on population averages. Individual patient simulation, using appropriately modeled predictive distributions for parameter uncertainty is probably the answer you want clinically. This is not realistic for 99% of practicing clinicians though.
That said, some resources I would recommend are:
Textbooks
- The “blue book” by Michael Drummond Methods for the Economic Evaluation of Health Care Programmes
- The “green book” by Briggs and Claxton https://www.amazon.ca/Decision-Modelling-Health-Economic-Evaluation/dp/0198526628/ref=sr_1_1?s=books&ie=UTF8&qid=1534334947&sr=1-1&keywords=decision+modelling+health+economics
Open source references (general):
- ISPOR good modeling practices State-Transition Modeling: A Report of the ISPOR-SMDM Modeling Good Research Practices Task Force-3
- Markov Decision Processes: A Tool for Sequential Decision Making under Uncertainty
- Guidelines for the Economic Evaluation of Health Technologies: Canada
Open source resource (individual participant simulation)
Bonus that I think @f2harrell might like:
Note that as per @f2harrell all the health economic methods really do is built a loss function which you then minimize. The tricky bit then becomes (as @f2harrell states) whose loss function do you use, and what happens if you specify it incorrectly.
5 Likes
Please discuss this particular topic on the other topic page we have set up for teaching probability. I think you are falling into the trap of assuming that probabilities don’t apply to individuals. If this were the case there would be no gambling on individual football games or horses, and you would think differently (or not at all) when deciding whether to carry a large metal stick out on a golf course in an electrical storm. It’s best not to use the term group probabilities. The probabilities we calculate in medicine are learned from a group but are intended to apply to individuals, at least if such individuals were adequately represented in the heterogeneous group. Let’s pick this up on the other topic. It’s all about playing the odds, and “in the 10% who don’t survive” is a phrase that does not help because it is a retrospective way of looking at things and is not useful at the early decision point IMHO.
1 Like
Thank you @bryll. One point you bring up that I had not considered: some patients will be very upset to learn that their risk of stroke is 0.01, others will be unaffected. Guiding individual patients through their unique experiences of risk, maybe we could call it “risk management,” is important and should be addressed in a lecture on medical prediction.
So, we have, in temporal order, (1) risk estimation, (2) risk interpretation, (3) risk communication, and (4) risk management. I have focused on (1) and (2). There is a decent literature on (3) including Spiegelhalter’s work (https://understandinguncertainty.org) as mentioned by @f2harrell. Can (4) be taught as well? Maybe stories on the subjective experience of risk would help.
Great points, and this makes me wonder of the usefulness to patients of simultaneously communicating reference risks. Perhaps Spiegelhalter has discussed this. For example, compare the 0.01 to the risk of getting killed in a car accident with 5 years of 10,000 miles per year of driving.
1 Like
Yes something to anchor the risk to risks people generally accept and to risks they generally don’t accept
1 Like
Throughout my, albeit short, medical career I have sought out a “reference set” of risks to compare to when discussing risks with my patients. Patients usually only hear about probability when discussing distressing medical information. They have no frame of reference, nothing to compare to. So as they are being told about diseases and procedures they don’t understand, they are also being communicated to in probability and risk with no “patient-world” tie-ins to guide them.
I think MDs underestimate this lack of a frame of reference. Most MDs are married to MDs, their friends are MDs - they are constantly marinated in medical terminology. I teach my students to cherish and ruminate on their meetings with banks and mortgage loan officers, to remember how stupid they felt, how they agreed and nodded to questions and statements they did not understand, how they signed papers in blind trust of this person they had never met before, partially because they didn’t feel like they could admit how little they understood of what was just said.
I wish there were a intuitive reference list of risk from the day-to-day lives of the population. Fender-benders and other car-related statistics seem like they would fulfil this criteria, as you mentioned. Local weather patterns maybe, “the same probability as snow in June”.
6 Likes
I wanted to post a link to the slides - very appreciative of the discussion here.
1 Like
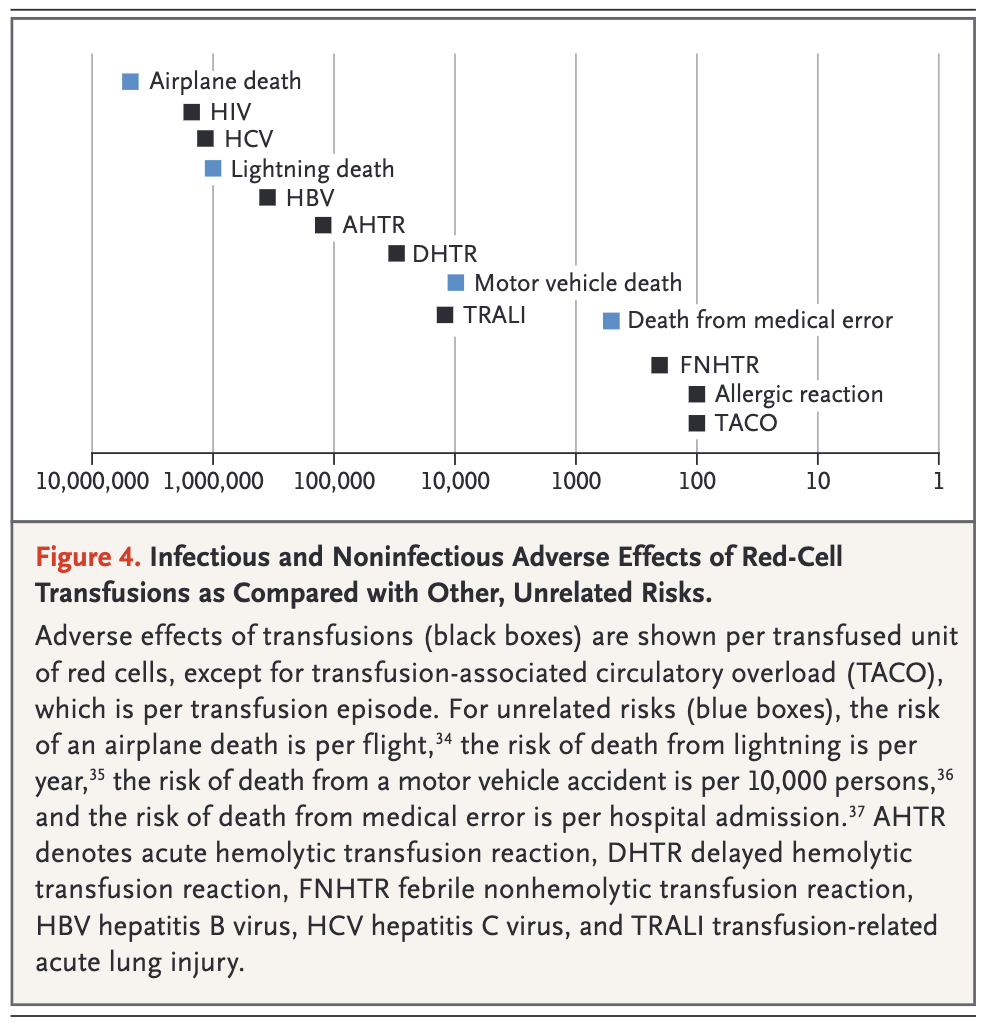
This is tangental to the topic, but still - I wanted to share one of the best communicative visualisations of risk that I have seen in a medical publication.
The article is Indications for and Adverse Effects of Red-Cell Transfusion by Carson et. al in NEJM in 2017 https://www.nejm.org/doi/full/10.1056/NEJMra1612789 . There, the authors discuss rare transfusion reactions and recognise the need to provide context to the risk of these reactions occurring. Some of the reactions may be catastrophic, such as contracting HIV. But as the figure clearly demonstrates, these occurrences are rare, and are more unlikely to occur than dying of a lightening strike. My only gripe is that the figure provides the demonstrably incorrect statistic of deaths from medical errors.
2 Likes
Interesting - thank you for sharing. Risk communication did come up last time I gave the lecture, and I would expect it to come up more often in the future. In particular they were asking how to communicate risks and elicit utilities.
I do not have much real clinical experience counseling patients based on risks yet, but I would be interested to learn more about how these types of statistics could be used for shared decision making. Something about the comparison of risks here (and also probably it would be the same with utilities) seems more feasible than trying to interpret absolute values
Hi!
Late comer here, thread popped up recently while working my way through BBR. I have also given this a far amount of thought b/c I also have an opportunity to teach my peer residents. That cohort might be a bit different as most already harbour a set of (mostly incorrect) conceptions.
@samw235711 I have checked out your presentation and my first impression was that you are aiming much higher than anyone I have encountered during my medical training. In my context, I am almost certain that most of my colleagues would need less technical details and more real-life examples to make this relevant and digestable.
My priorities about what to focus on so far:
1, Transposed conditionals - eg P (being a surgeon | having an MD) vs P (having an MD | being a surgeon). My impression is that this is the most accessible way to understanding the problems with both NHST and sens/spec metrics.
2, Base rate fallacy - This to reiterate how misleading send/spec can be under a low prevalence / pretest probability condition.
3, Some bad and good examples of diagnostic probabilistic thinking - I was thinking to show some more bad examples with cutoffs (eg. CRP, a widely used marker where I work, emphasizing their dependence on the context they were derived in). On the other hand, a good example I think would be some clinical decision rules. One of the most widely used in pediatric emergency medicine is the PECARN criteria for identifying low-risk head injuries in children which don’t require a CT scan. The original paper (here) is considered one of the best studies in the field and did result in a prediction model that is similar to what Frank advocates instead of sens/spec, ie. P(disease | age, certain history & physical exam findings). However they used binary recursive partitioning and from another thread I got the impression that this may not be considered an optimal choice by some statisticians? (My understanding is that they are most problematic for continuous variables, not for categorical as in this case. They did validate it on a separate dataset, and a number others since so overfitting doesn’t seem to be an issue here, in hindsight.) Maybe you could point me to clinical decision rules where the derivation process would be considered statistically adequate (eg. Wells, PERC, HEART score?). I feel that this area (CDRs) is where the explicit probability statements are not transposed and easily interpreted.
4, Utilities & communication - This is especially interesting in my field (pediatrics) where the probability statements concern the patient but the utility judgements come primarily from the caregivers. I mean that most people would accept a much lower residual risk after a diagnostic workup for their children than for themselves. If you also take into account that disease prevalence in general is much lower in this population you end up with some very low probabilities which are especially hard to put into context and communicate. The most useful way in my experience has been to contrast it with the risk of side effects from further investigations. An easy example is the risk of cancer from radiation from a CT scan as opposed to the probability of disease before doing the scan. The other, very paternalistic but still prevalent way of communicating is to have a personal threshold below which you consider the risk to be insignificant and thus basically imply and communicate that it is zero. The reality is that in many situations and interactions this strategy is very hard to escape, especially if you lack a reasonable alternative. The problem is of course that for most diseases you cannot obtain such a precise risk estimate as for example the PECARN rule above and thus one is stuck with heuristics (for presentation A we usually do B, if that is negative we can consider disease C ruled out). These are of course still good empirical solutions, but the question is, as Frank stated before, whether in the era of computation we can do better.
Sorry for the long comment, I hope you might have some feedback or further pointers.
1 Like
These are wonderful concepts to cover, and I can just think right now of two angles to include:
- Explain why dichotomization of a piece of diagnostic information (e.g., cholesterol) force one to collect more variables to make up for the loss of information
- Explain that even when decisions are dichotomous, that has nothing to do with inputs to the decision needing to be dichotomous
- An example of the latter is that in sports very few things are dichotomized; the decison to draft a baseball player will come from his actual batting average plus other things. Baseball managers use batting average completely continuously, just like we use our car’s speedometer.
In 1997 Moons et al reported based on observations in empirical data that ‘single values for the sensitivity, specificity and LR of a test do not exist, and therefore the commonly proposed use of Bayes’ theorem has major limitations in the assessment of diagnostic probabilities’
What was not realized then was that Bayes’ theorem operates at a specific threshold of a test and if two different datasets (e.g. through sub-grouping of data) have different prevalence of the outcome, then they also have changes in the implicit threshold and the likelihood ratios must vary across the datasets as should sensitivity and specificity. In each dataset however, the likelihood ratio, prevalence odds and posterior odds will align with Bayes’ theorem. Therefore what we need to teach MDs is that prevalence of disease and test-threshold are more or less the same thing and this will take away the confusion. Bossuyt responded saying that ‘Bayes’ rule does not need to be buried, just because its use is slightly more complicated than it seemed to be.’ and I agree with this completely.
It’s a bit worse than that. If the disease is truly all-or-nothing sens and spec still vary with patient characteristics. It’s not Bayes’ rule that is the problem; it’s the use of constants for sens and spec.
A fundamental problem is that in most of the examples in medical school the data arrive prospectively so one can estimate disease probability without even using Bayes’ rule. Three left turns to make a right turn.
Agree, and this can easily be proven mathematically
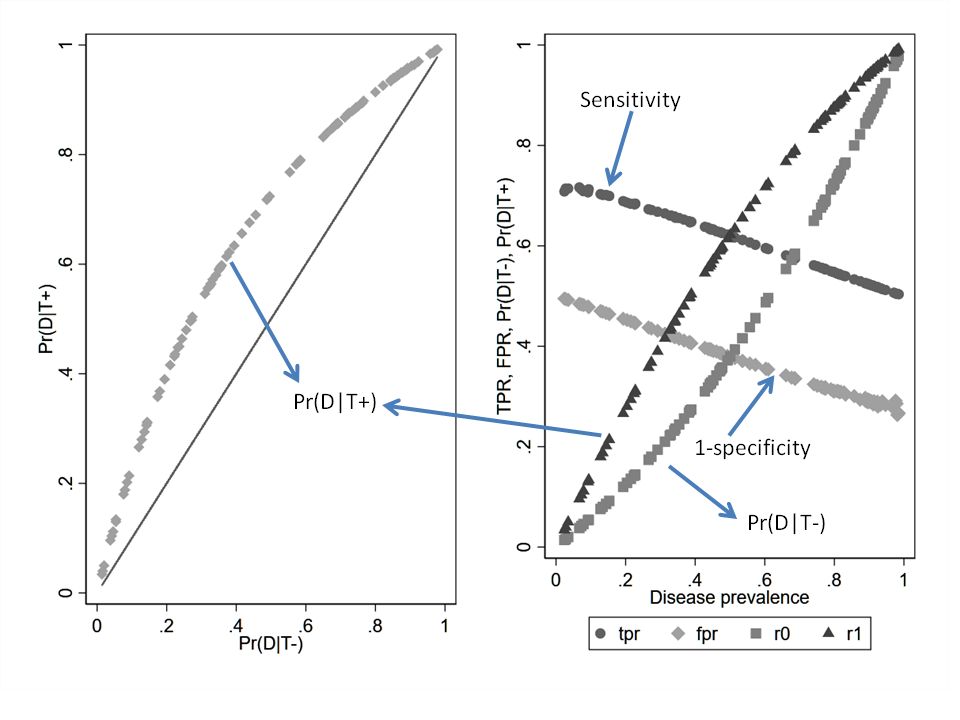
If we simulate 100 diagnostic studies that fall on a single ROC curve then the variation dependence on prevalence is clearly seen for Se and Sp even though test discrimination is held constant
So why do textbooks always say that Se and Sp belong to the test and treat them as constant? @HuwLlewelyn what is the position taken by the Oxford Handbook of Clinical Diagnosis?
Hi Suhail. In my experience, experienced medical practitioners do not interpret diagnostic tests by dichotomising them first but interpret each value individually. This process can be modelled by creating curves displaying the probabilities of an outcome conditional on medical test results by using logistic regression etc (for example, see Figures 1 and 2 in this recent post Risk based treatment and the validity of scales of effect ). This means that sensitivity and specificity, ROC curves etc are not very applicable to clinical practice and cause confusion; they are tools for use public health as far as I can understand so I hardly mention them in the Oxford Handbook of Clinical Diagnosis.
Bayes rule is also used rarely in the differential diagnostic thought process, which is based on lists of diagnosis associated with individual symptoms, signs or test results. Each diagnosis has a ‘posterior’ probability conditional on the test result based on the directly observed frequency of each diagnosis in those with the finding. If a diagnosis occurs in more than one list of the findings of a patient then this increases the probability of that diagnosis. I explain the probability theory of this process too in the Oxford Handbook of Clinical Diagnosis.
Consistent with @HuwLlewelyn I would not bring ROC curves into the discussion or condition anything on an ROC curve. Sens and spec vary for different, and simpler, reasons than that. It’s easiest to see with sens — when any categorization of a continuous disease process has been done, and the underlying severity is not used in the probability model, things happen because patients with more severe disease have their disease easier to detect. Any patient characteristic that is correlated with extent of disease will be related to sens. For example age and being male are associated with more severe coronary artery disease, and they are likewise associated with the sensitivity of a diagnostic cardiac test to detect significant disease (dichotomized).
1 Like
I would like to support your view on the severity of disease. The difference in ‘posterior’ probabilities between primary or secondary care is not mainly due to prevalence or incidence of disease in the community and hospital. I think that it is due to the difference of severity of disease in these different settings. For example, the proportion with myocardial infarction etc will be lower in the community where the average degree of chest pain mild; also the proportion with a self-limiting conditions of unknown nature that resolve spontaneously before their nature can be established is high. In secondary care (e.g. emergency rooms) symptoms like chest pain are more severe and the proportion with serious conditions is higher and those with self limiting conditions are lower. This is largely due to the way doctors in primary care refer patients with more severe symptoms to hospital as well as self-referral by patients and relatives. In my experience of working simultaneously in primary and secondary care (when I was a trainee) the probability of a disease conditional on a particular level of symptom severity is the same in primary and secondary care.
1 Like
If severity is greater in one data sample versus the other we refer to outcome. Say the outcome is death, then the only way to say severity is greater in one sample is when prevalence of death in that sample is higher. Say the ‘test’ is serum factor X, then in the more ‘severe’ sample the same X threshold will be lower in the distribution of X in cases than in the less ‘severe’ sample. Thus prevalence, severity and threshold are the same.
We could argue that if the outcome is heart failure then one sample could have selected only class IV heart failure and the other only class I heart failure at the same prevalence and therefore severity and prevalence are now distinct. Say the test is serum BNP at a fixed cutoff. In the class IV sample it will be lower in the distribution of BNP while in the class I sample it will be higher and sensitivity will still change. I would view this as two different outcomes because of selection rather than severity per se.