Risk based treatment and the validity of scales of effect

I was reminded by @Stephen Senn recently about my comment on Twitter some months ago that risk based models did not seem to work as expected because those with low risk seem to benefit more from treatment than predicted (i.e. more than expected from diagnostic reasoning). For example, statins are expected to reduce CV risk by lowering the cholesterol. Statins should not reduce risk by lowering BP. If the BP is persistently high resulting in high CV risk then statins shouldn’t help and this risk should be tackled with medication to reduce BP such as thiazides, ACE inhibitors, ARBs etc.

If we estimate overall CV risk using the Mayo Clinic Statin Choice Decision Aid for example, in a 65 year old white male when the lipid levels are perfect (high HDL=120 equal to the Total Cholesterol = 120 so that LDL=120-120 = zero) and the only ‘abnormality’ is a high BP of 250 mmHg (i.e. horrendous CV risk), then according to the Mayo risk model, statins dramatically reduce the overall risk from 16% to 10% (a risk reduction of 38%) as if statins had reduced the BP. This is a rather perverse causal inference from a medical point of view.

If the BP is at a perfectly low risk of 100 mmHg systolic and the HDL=10, Total Cholesterol 250 with an LDL=250-10=240 (i.e. a horrendous CV risk) then as expected high dose statins reduce the 10 year risk from 15% to 9% (a risk reduction of 40% similar to that for hypertension). If both risk factors are high risk e.g. the BP is 250 mmHg (i.e. horrendous) and the HDL=10, Total Cholesterol 250 with an LDL=250-10=240 (i.e. also horrendous) then as expected high dose statins reduce the 10 year risk from 55% to 33% (a risk reduction of 40% again as for statins alone).

What seems to be happening here is that the risk reduction of about 40% that applies to one covariate is being applied to other covariates too (including age, acting as an elixir of youth). If a blood pressure lowering agent is added, then this may genuinely reduce the CV risk due to high BP. This will be added to the spurious reduction of BP risk due to the statin thus over-estimating the treatment effect. In short, if the baseline risk is an overall risk based on a number of covariates (e.g. lipids, BP, age, HbA1c, gender etc), the risk reduction from one treatment should be calculated based on the change of risk for its target covariate alone (e.g. HDL, Total Cholesterol and LDL in the case of statins) This might be subtracted from the overall risk (or reduced according to some other mathematical model such as survival from a CV event).

DM1

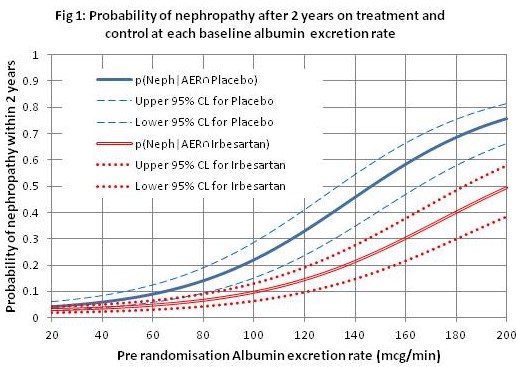
Trying to remedy the above issue creates all sorts of problems and has to involve many more assumptions that include the controversy as to whether we should use risk ratios, odds ratios or switch risk ratios to model treatment effect (discussed at length on DataMethods). I try to avoid the issue by fitting a logistic regression function to the control (placebo) and treatment (irbesartan) data that represent disease severity (albumin excretion rate - AER) in the RCT, instead of only fitting a function to the control data and assuming a constant OR or RR across all degrees of severity to estimate the treatment curve. When functions are fitted in this way (see Figure 1 showing the probabilities of nephropathy conditional on different values of the AER as a measure of disease severity), the OR and RR do not appear to be constant across the range of disease severity (see Figure 2).

DM2

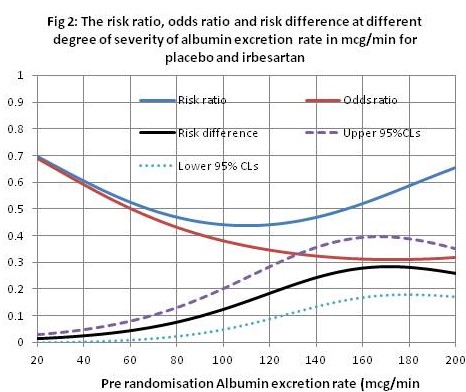
This approach represented by Figure 1 can be taken with all the covariates that affect the probability of an outcome (e.g. in the case of nephropathy, the HbA1c that is a reflection of blood sugar control, blood pressure, age, etc.). The probabilities of the outcome conditional on the individual patient’s test result is read off from each curve and substituted for the average ‘prior’ probability before that patient’s current result became known minus the intercept to avoid double counting the effect of other covariates (the intercept is about 0.04 in Figure 1). Instead of adding these individual probabilities (e.g. 0.373, 0.02, 0.107, 0.056 and 0.0069) the product of their complements is calculated (e.g. (1-0.373)(1-0.02)(1-0.107)(1-0.056)(1-0.0069) = 0.514 (the probability of survival from nephropathy), the probability of the outcome of nephropathy being 1-0.514=0.486. I am flying a kite with these calculations in an Excel spreadsheet (accessed via this link: https://osf.io/6k28v for those with the energy, patience and familiarity with Excel). The probability of nephropathy on control and conditional all the simulated covariates was 0.486, reducing to 0.284 (RD=0.202) on two treatment effects applied to their own individual covariates alone read from curves such as that in Figure 2.

I also make some calculations by assuming that the probability of nephropathy as estimated in Figure 1 by the AER is little affected by the other covariates that are represented by the 95% confidence intervals at different degrees of severity. In clinical practice we try to design tests that dominate in this way (e.g. MRI appearances, free thyroid hormone concentrations, AER etc). For example, the probability of nephropathy conditional on control and an AER of 133mcg/min was 0.413, reducing to 0.188 (RD=0.225) on irbesartan alone see Figure 1). This is the approach that I would favour. The problem is that ‘improving’ the prediction by reducing potential bias from other covariates that have less influence on the probability of the outcome (as in the previous paragraph) will also increase the variance of the latter and greatly widen the 95% confidence intervals, thus perhaps being counterproductive. The possible methods like the one suggested by me are also complicated and full of dodgy assumptions.

I also applied the ‘dodgy’ product of two risk ratios to the control probability of nephropathy (in an analogous way to the statin calculation in the third paragraph above). In that case, the probability of nephropathy on control and conditional all the covariates was 0.486 again, but 0.194 (RD=0.292) on the product of two risk ratios applied to all individual covariates. This example exaggerates the risk difference compared to the other two methods as for the statin example in paragraph 3 above.

Perhaps the way to compare these approaches is to calibrate the probabilities of the outcome based on the different methods. I would be grateful for comments and advice about these thoughts.

1 Like

Very nice. See here how we currently attack such problems. A popularization for clinicians and statisticians is forthcoming. Earlier popularization of some key considerations here. Future technical evolutions also in the works.

3 Likes

Wow, can’t wait to hear more about i!!

1 Like

I infer that you view the impact of lipid status as mechanistically divorced from the effects other cardiovascular risk factors when estimating future cardiac risk. You don’t consider it plausible that statin use could meaningfully reduce future MI risk in a primary prevention context in patients with LDL values that “look good.” You are basically questioning the value of statins in a primary prevention context for patients whose cardiovascular risk primarily seems to be driven by non-lipid risk factors. You seem to view this practice as a type of “overprescribing.”

I view cardiovascular risk reduction differently than you do. Rather than considering lipid status to be divorced from the effects of other CV risk factors (such as diabetes, age, smoking status, BP status), I view them, mechanistically, as closely intertwined/interactive. Specifically, I see all these risk factors as working in concert with each other, and with lipid status, to generate a physiologic “milieu” that is more or less likely to promote lipid plaque deposition in arterial walls or to contribute to the risk of plaque rupture. For example, maybe some of the other risk factors promote inflammation of the vasculature or increase arterial wall stress, making lipid plaque more likely to deposit or rupture at a given LDL than in patients without these other factors.

For example, if I am considering two patients of the same age, with identical lipid profiles, one of whom is a smoker with hypertension, I will estimate a higher 10 year MI risk for the patient who is the smoker. I would consider that he is more likely than his counterpart to deposit lipid plaque or to experience rupture of already-existing plaque than his non-smoking counterpart AT THAT LDL level. In other words, I view the second patient as being less “tolerant” of a given LDL level before he will start to experience consequences from it. So in short, it seems very reasonable to me that we focus more on a patient’s global cardiovascular risk rather than his LDL-attributable risk alone when we’re trying to predict the potential impact of statin treatment.

I’m not a lipid expert or a cardiologist, so I don’t know if my conceptualization is reasonable or not. It would be interesting to hear other opinions…

2 Likes

Don’t remember much about statins but to see physicians discussing these topics by connecting putative mechanisms to data is gorgeous. This is the way!

1 Like

Thank you @ESMD for making a very important point. I am of course aware of the theories about the possible mechanisms of actions of statins especially their possible anti-inflammatory effect in reducing or reversing plaque formation whatever its ‘cause’. However statins were ‘invented’ specifically to improve lipid profiles so that any other effect such as benefit via an anti-inflammatory or some other action would have been fortuitous. I don’t know whether there have been RCTs to show their effectiveness in lowering CV risk in those with low risk lipid profiles and whether the theories you describe have arisen to explain these observations. It is also possible that the theories have been formed to explain erroneous high risks of CV events generated by faulty mathematical modelling when the lipid profile is low risk and other factors such as BP are high risk. I strongly suspect that possibility and would be interested to know whether such RCTs have been done of which I am unaware or whether some are planned. I will look into this and would be interested in what you might find too.

1 Like

Hi Huw

I wasn’t really highlighting purported “pleiotropic” effects of statins (e.g., anti-inflammatory effects) to explain why statins could benefit patients with relatively “normal” lipid profiles. Rather, I was suggesting that a benefit of statins could perhaps still be expected even in patients with benign-appearing lipid profiles if the effects of LDL are “mediated” by the other CV risk factors that are present in a given patient. If you have two patients with some existing LAD coronary artery plaque (but asymptomatic to date), each with an LDL of 3.2, but one is a normotensive nonsmoker, while the other is a hypertensive smoker, maybe the hypertensive smoker’s plaque is more likely to rupture than the other patient’s LAD plaque over the next decade, all else being equal. And maybe starting the hypertensive smoker on a statin, even though his LDL “looks okay” will end up meaningfully reducing his future MI risk by stabilizing his plaque (?) I don’t think that plaque stabilization would be considered a “pleiotropic” effect of statins (?)

I don’t know the right statistical lingo to use here- maybe “mediated” isn’t the right word to describe the interaction between LDL and the other risk factors…

4 Likes

To give us a feel of your data, could you look at probabilities of nephropathy at 2 years within deciles of AER and then plot Pr(neph=1|treat=0,deciles) on the X-axis versus Pr(neph=1|treat=1,deciles) on the Y-axis. This will give an idea of what the probability curve looks like - if its similar to a symmetrical ROC curve then you can assume that AER has a linear relationship to nephropathy on the logit scale. If not, then there is non-linearity and you may need to use splines in the regression model. I am happy to run this and post here if you could share the deidentified data via email (in excel format)

1 Like

Hi Erin
The reason that I invoked the statin’s anti-inflammatory theory was that in my example, I postulated an unrealistically extreme case of a ‘perfect’ lipid profile with an LDL cholesterol of zero, a total cholesterol of 120 and a HDL of 120. In other words, there was no scope at all for reducing CV risk by improving the lipid profile any further, so another mechanism such as an anti-inflammatory effect of statin would have to be postulated. There are papers that claim that improving very low risk lipids to reduce CV risk even further but obviously none on patients with no lipid risk at all as these would be fictitious. However, taking an extreme value is a way of testing mathematical models and in this case it appears to reveal a flaw. Furthermore, assuming in a mathematical model that statins reduce risks to the same extent for all risk factors seems very unrealistic. To my mind it is more plausible that they reduce the risk via reducing the lipid profile alone or perhaps via a few other covariates.

1 Like

Thank you @s_doi. Both logistic regressions were based on first fitting a linear regression to a series of five ln(odds) based on data every 40mcg/min along the AER baseline up to an AER of 200mcg/min for the control and treatment data. The plotted logistic regressions with AER as baseline were based therefore on exp(ln(odds)) when the ln(odds) were computed from the resulting coefficients of the linear function. Plotting the probabilities of these sigmoid curves on a logistic scale (i.e. ln(AER)) would therefore by definition and circular argument be linear. However, they were not parallel straight lines (as they would have been if the OR had been constant).

I also made a slight refinement. If the system of probabilities generated by the various assumptions were coherent, then the mean probabilities read from the curve conditional on each of the AER values in the data set used to generate the curves would be equal to the proportion with nephropathy up to that threshold. The same would apply above the threshold. This was not quite the case for the logistic regression curve. In order to satisfy the ‘coherence’ condition I fitted a correcting linear function so that the condition was satisfied. This means that the final curves were not strictly logistic regressions functions but slight modifications of the latter.

1 Like

Huw as always you’ve stimulated a great discussion with cogent writing and examples. I think it would be worth finding the paper where both direct and indirect effects of statins were reliably estimated using, I think, mediation analysis. It may shed some light.

2 Likes

Thank you @f2harrell. I have searched for mediation analyses of statins on CV disease via lipid metabolism. A sample of what I found suggests much complexity, as expected by @ESMD and me. For example “This study suggests a potential causal pathway between statin and coronary artery calcification or CAC (the positive association of statin on CAC) through HDL-cholesterol as an inhibitor (Investigating potential mediator between statin and coronary artery calcification)” and “The increased risk of dyslipidemia on CAD was partly enhanced by elevated mean platelet volume levels, whose mediating effect was around 20% (https://doi.org/10.3389/fcvm.2022.753171)” and “Lipid plays a partial mediation on the association between smoking and CAD risk (Mediating effects of lipids on the association between smoking and coronary artery disease risk among Chinese | Lipids in Health and Disease | Full Text)” and “Improvement of remnant lipoproteinemia may be an important mediator for the relationship between improvement of endothelial dysfunction and LDL-lowering after statin treatment in patients with CAD (Redirecting)” etc. etc.

We could therefore incorporate some of these mediators as covariates into a RCT and the resulting risk calculation and then assess the performance of different methods when trying to differentiate between people at higher and lower risk and the effect this has on effectiveness of treatment (whereas the overall effect over all levels of risk or odds ratio as assessed by a RCT should be the same). The question is how to make this assessment. My approach with a single variable (the albumin excretion or AER) was to plot a ROC curve and to identify the point where the sensitivity and specificity with respect to the outcome of nephropathy were the same, and to dichotomise the AER data at this threshold.

The threshold was found for the combined data on placebo and treatment in order to identify a point common to both. This allowed the proportions with the outcome in those below the threshold to be found for those on placebo and treatment. The same proportions were found above the threshold. The difference (or ratio) between the proportions above and below the threshold is a measure of the predictive performance of the covariate (the AER in my example). It should be the same for the treatment and control data; therefore a better estimate might be obtained by combining the control and treatment data. The risk and odds ratios between treatment and control can be found above and below the thresholds.

If the probability calculations were based on more than one variable, then the assumptions required might very well create bias in the probability estimates. This could be addressed by regarding the probabilities created as variables in their own right. They (or some transformation of them) could be used to plot a ROC curve and the point identified where the sensitivity equalled the specificity as a threshold. The performance of the multivariable ‘test’ could then be assessed as in the previous paragraph. A comparison could also be made between different methods (e.g. for the three approaches described in my original post no 1 above).

Fitting a logistic regression function to the control and treatment data (or applying an overall odds ratio or risk ratio to the control curve to estimate the treatment curve) is a quite separate issue. Assessing the validity of the resulting theoretical probabilities based on the many assumptions (e.g. assuming that the underlying true curve will be a sigmoid logistic function) would have to be done separately.

Do you all think that this would be a reasonable description of how diagnostic tests should be assessed for use when predicting the probability of outcomes with and without treatment?

1 Like

Huw- In case you’re interested, here are some articles I’ve read previously that speak to the enormous complexity of lipid biology (with which you’re certainly familiar). There’s a great figure at the beginning of this one:

Another one: Low-density lipoproteins cause atherosclerotic cardiovascular disease. 1. Evidence from genetic, epidemiologic, and clinical studies. A consensus statement from the European Atherosclerosis Society Consensus Panel - PMC

Tables 2-4 are interesting.

Sorry that I don’t have the training to comment on the statistical aspects of your post…

3 Likes

Hi Frank. A quote from your blog; “To easily account for known outcome heterogeneity, it is a good idea to pre-specify known-to-be-important covariates for the primary analysis of an RCT.” Question: Do you think that the way to assess the performance of a multivariable test (e.g. the Q-risk for cardiovascular disease) would be to calculate the CV risk for each patient from baseline data (e.g. lipid profile, BP, age etc.) before randomisation, The risk could then be regarded as a covariate for primary analysis to see how well it predicts the outcome on treatment and placebo as in my Figures 1 and 2 in post 1. If the scoring system creates well calibrated probabilities for treatment and control then the ‘curves’ would be lines of identity!

Huw if you had a validated model that had decent predictive discrimination (e.g. R^2) then adjusting for its component variables through the use of the predictive score is a kind of ultimate pre-specification and would bring a bit more stability to the final analysis. If the score is a predicted risk the current RCT model’s link function (e.g., logit for binary or ordinal Y) would be applied to it in the RCT outcome model. This will automatically allow the score to be recalibrated if needed. We did this in a sepsis clinical trial many years ago. Let me know if you want the reference.

Yes please => hul2@aber.ac.uk

Thank you for showing me the paper. One basic message is that if a probability estimate is based on a single variable or multivariable score to be used as a covariate then it has to be performed on all the subjects of a RCT before randomisation and then a logistic regression fitted to the data from both limbs. In the case of a probability estimate, this would allow it to be calibrated as in your paper by plotting predicted mortality against observed mortality based on a series of ranges. I gather that you were only able to it to a non-interventional or ‘control’ limb. (Or was it for all the data as the planned RCT showed no difference between control and intervention and was not published?) If the RCT had showed a difference you have been able to estimate the probabilities of the outcome for the control and intervention limbs.

The IRMA2 data that I had were sparse (under 200 subjects in each limb compared to your 1195). I calculated the regression function from ln(odds) for 5 ranges at regular intervals of AER (for the placebo curve the natural odds were 1/76, 9/48, 9/23, 9/14, and 2/5). I was therefore not confident at all in the result! I therefore ‘calibrated’ it on the basis of two ranges only by dichotomising the data (above and below an AER of 80mcg/min) and adjusting the probabilities with a linear transformation so that the average of the ‘predicted’ probabilities from the curve above and below the dichotomising threshold were equal to the frequencies of nephropathy above and below.

I took the view that these predicted probabilities conditional on each AER result were totally theoretical and based on the placebo data set of 196 observations as a whole. However the ‘theoretical’ probabilities of nephropathy conditional on each AER from Bayes rule depended on the ‘prior’ frequencies of nephropathy in those on placebo for example (30/196), the theoretical distributions of the prior probability of each AER in the total data set and the theoretical AER likelihood distribution in those with nephropathy.

The variance of the means of the latter two distributions (and the probability density of each AER value in the distribution was minimal) so I reasoned that the variance of each ‘theoretical’ p(Nephropathy|each AER value) depended essentially on the variance of the proportion with nephropathy in all those on placebo (i.e. 196 subjects). I therefore flew a kite by estimating the ‘theoretical’ 95% confidence limits based on P = p(Nephropathy|each AER value) and N = 196. All we can say about these theoretical probabilities is that their average is equal to the frequencies of nephropathy above and below the dichotomised threshold of an AER of 80mcg/min. What do you think? What would be the conventional way of doing this for comparison?

1 Like

Just some general comments. The risk model is fitted on patients we think are similar to the control-arm patients in the new trial. And it doesn’t matter if the model is calibrated as long as it is transformed so as to have a reasonable change of operating linearly in the RCT model, and as long as it doesn’t seriously underfit the variables involved in he store. That is even unlikely to matter unless for example the score has 10 predictors and one of the more important predictor’s coefficients is too small due to overfitting other predictors or mismodeling.

2 Likes