I take your point. I tried to combine the estimated distribution as if it were a Bayesian prior distribution based on knowledge of the proposed study, with the actual result of the first study to get a posterior estimation. I agree that the reasoning doesn’t work in this setting. I will therefore use the term ‘Bayesian-like’ because I don’t intend to use the estimated distribution in a Bayesian manner by combining it with a likelihood distribution to get a posterior distribution. It is the following five approaches (A) to (E) that I am proposing as being legitimate:
(A) To estimate the probability of replication ‘x’ to get P≤y (1 sided) in a second study when the first study’s observations are known already: (i.e. (1) the number ‘n’ of observations made, (2) the observed difference ‘d’ of the mean from zero and (3) the observed standard deviation ‘s’). This approach is based on doubling (*2 in the formula below) the variance being calculated from the above 3 observations.
x = NORMSDIST(d/(((s/n^0.5)^2)*2)^0.5+NORMSINV(y)) Equation 10
(B) To estimate the number of observations ‘n’ needed for a power of ‘x’ to get P≤y (1 sided) in the first study from a ‘Bayesian-like’ prior distribution based on prior knowledge of the planned study that allows an estimate to be made of the difference of the mean from zero ‘d’ and an estimated standard deviation ‘s’. This calculation involves doubling the variance of the Bayesian-like prior distribution (applied by ‘/2’ in the formula below).
n = (s/(((d/(NORMSINV(x)-NORMSINV(y)))^2)/2)^0.5)^2 Equation 11
(C) To estimate the number of observations needed for a power of x to get P≤y 1-sided in the second study from a ‘Bayesian-like’ prior distribution based on an estimated difference of mean from zero ‘d’ and an estimated standard deviation ‘s’. This calculation involves tripling the variance of the Bayesian-like distribution (applied by ‘/3’ in the formula below).
n = (s/(((d/(NORMSINV(x)-NORMSINV(y/2)))^2)/3)^0.5)^2 Equation 12
(D) A ‘what if’ calculation based on the above Bayesian-like distribution by calculating the probability of replication ‘x’ of the first study based on doubling the variance of the Bayesian-like distribution (applied by ‘/2’ in the formula below) and by inserting various observation numbers ‘n’, various values of the difference of the mean from zero (d), the standard deviation (s) and the desired a 1-sided P value ‘y’, into the expression. This can be used for sensitivity analyses of the parameters of the Bayesian distribution.
x = NORMSDIST(d/(((s/n^0.5)^2)*2)^0.5+NORMSINV(y)) Equation 13
(E) A ‘what if’ calculation based on the above Bayesian-like distribution by calculating the probability of replication ‘x’ of the first study based on tripling the variance of the Bayesian-like distribution (applied by ‘/3’ in the formula below) and by inserting various observation numbers ‘n’, various values of the difference of the mean from zero (d), the standard deviation (s) and the desired a 1-sided P value ‘y’, into the expression. This can be used for sensitivity analyses of the parameters of the Bayesian distribution.
x = NORMSDIST(d/(((s/n^0.5)^2)*3)^0.5+NORMSINV(y)) Equation 14
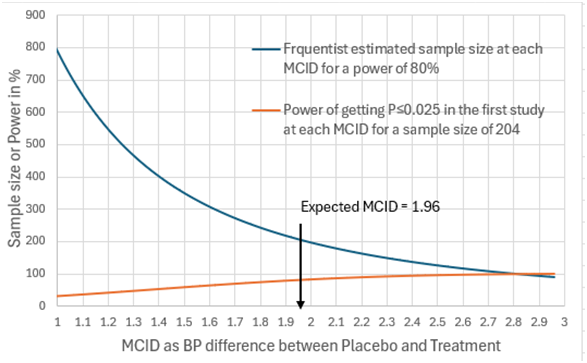
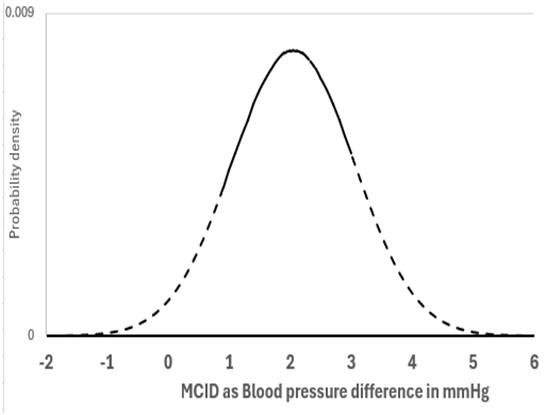
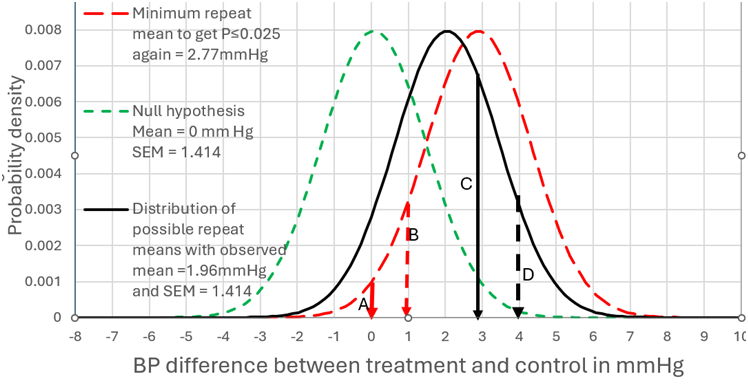
I will address your interesting point about non trivial differences. The best diagram I have is with the example of a mean difference of 1.96mmHg BP difference and a SD of 10. Figure 1 can therefore represent scenario (A) when the number of observations was 100. In this case there was a probability of replication of 0.283 for a one sided P value:
=NORMSDIST(1.96/(((10/100^0.5)^2)*2)^0.5+NORMSINV(0.025)) = 0.283 Equation 15
This corresponds to the area to the right of arrow C of the distribution under the black unbroken line) where P≤0.025 in the replicating study (i.e. all BP differences ≥2.77mmHg).
By assuming that the prior probability conditional on the set of all numbers is uniform (i.e. prior to knowing the nature of the study), then when P=0.025, the probability of the true value being a BP difference of ≥0mm Hg is 0.975 (see the area to the right of arrow A in Figure 1 under the green dotted distribution). For a non trivial difference of 1mmHg BP we look at the area to the right of arrow B, where the probability of the true value being a BP difference of ≥1mm Hg is 0.831 and P=0.169 (1-0.831). The probability of getting the same result again is also 0.283.
If we move the arrow C to D (from a BP difference of 2.77mmHg to 3.77mmHg) then this BP difference of ≥3.77mmHg accounts for 10% of the results. They correspond to P≤0.003824 for the green dotted distribution at the broken black arrow D. The probability of the true value being a BP difference of ≥0mm Hg conditional on a result mean of 3.77mmHg is 0.996176 (1-0.003824). This is represented in Figure 1 by moving the red dotted distribution from a mean of 2.77mmHg (the big black arrow) so that the mean is 3.77mmHg (the small broken arrow D). However, the probability of the true value being a BP difference of ≥1mm Hg conditional on an observed mean of 3.77mmHg is 0.975. There is a probability of 0.100 that this will also be the case if the study is repeated (corresponding to the area under the black unbroken distribution to the right of arrow D).
NORMSDIST(1.96/(((10/100^0.5)^2)*2)^0.5+NORMSINV(0.003824))=0.100 Equation 16
Figure 1:
In conclusion, these arguments depend on a number of principles:
- The prior probability of each possible result of a study is uniform conditional on the universal set of rational numbers (and before the nature of a proposed study, its design etc is known). This means for example that the probability of a result being greater than zero after continuing a study until there is an infinite number of observations, equals 1-P if the null hypothesis is zero.
- The Bayesian-like prior probability distribution of all possible true results is a personal estimation conditional on knowledge of a proposed study and estimation of the distribution’s various parameters.
- During calculations of a probability of achieving a specified P value, of replication of a first study by a second study, estimation of statistical power or the number of observations required, this Bayesian-like distribution is not combined with real data to arrive at a posterior distribution, but its estimated variance is doubled or tripled.

