My Bayesian prior in this forum is the humble “I don’t know,” so my only hope is to be a useful fool by attracting correction.
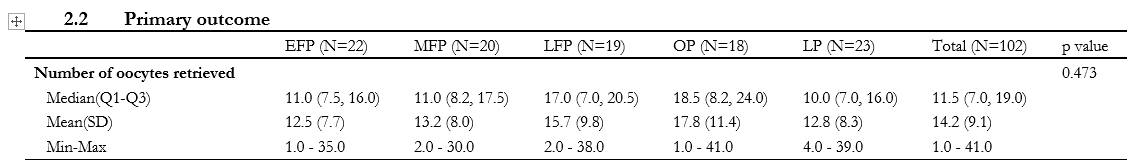
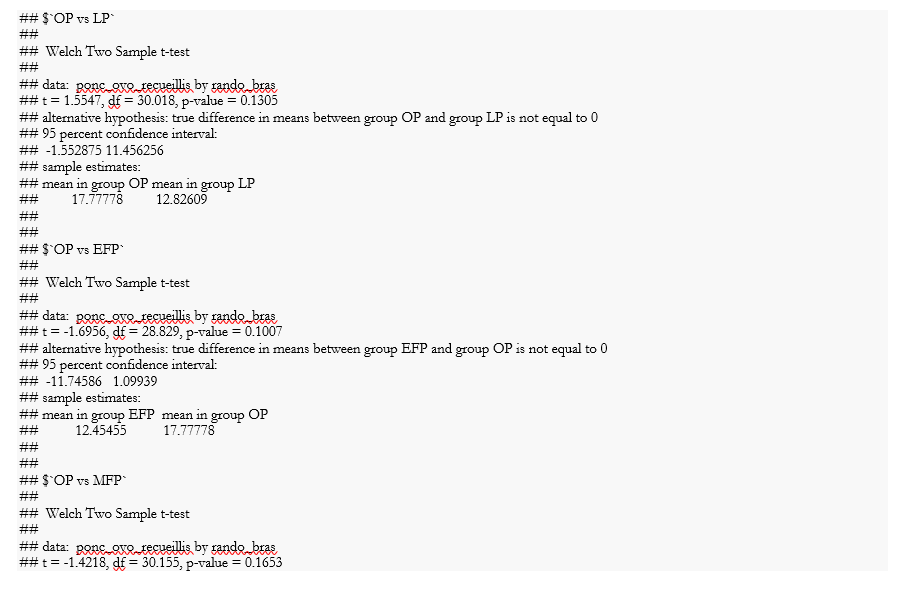
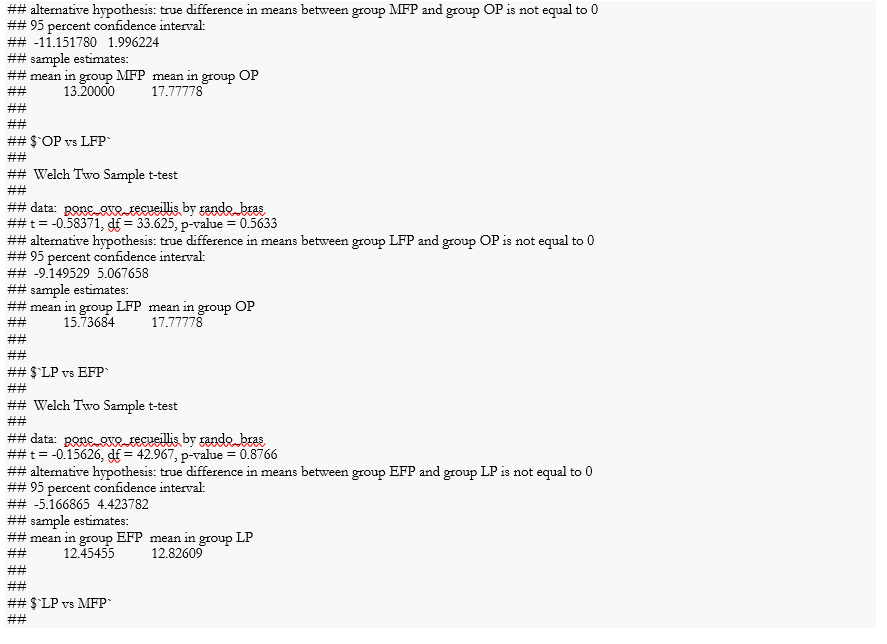
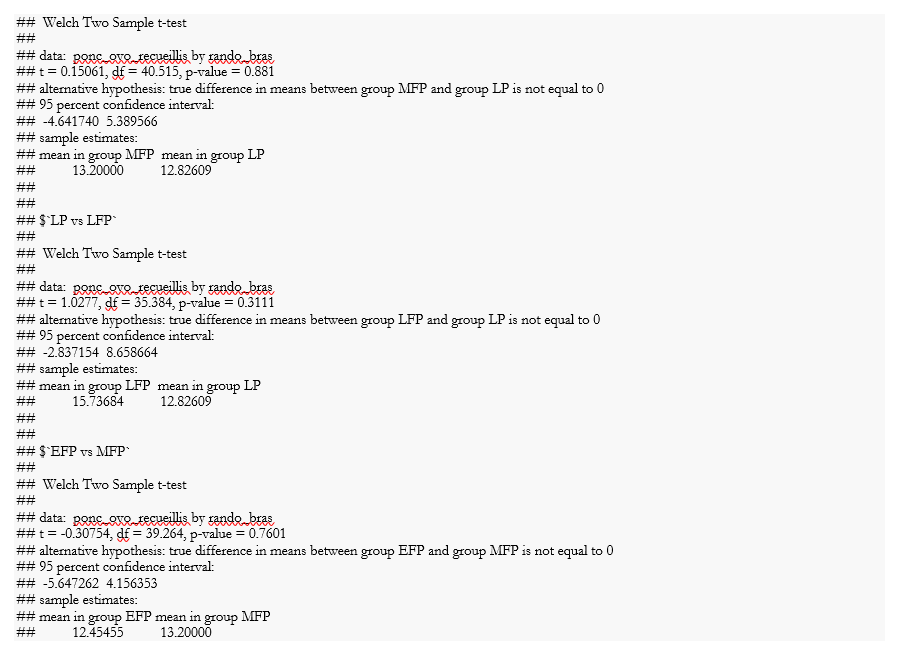
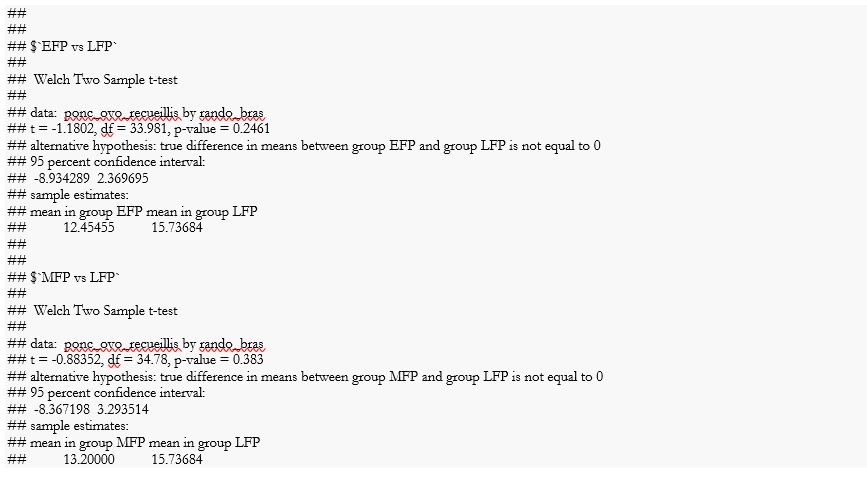
If I read the screen shots correctly N ≅100 with five treatment groups of about 20 each and the goal is to understand whether the apparent differences in the number of oocytes retrieved between and among groups, at a chosen \alpha are, or not, due to random variation. The motivation is to understand when best to apply ovarian stimulation for in vitro fertilization if the treatments are not equivalent.
When posing the question like this
I have a question in biostatistical analysis in the domain of in vitro fertilization. I have observations of oocytes retrieved from 20 subjects each in 5 treatments and I want to know if the differences between and among treatments at a given level of significance do, or do not, differ significantly with respect to the mean, median or range of counts of the treatment. How should I think of the problem with respect to the power of N and possible unobserved variables?
I got the following response
Here are a few key considerations for analyzing oocyte counts across different IVF treatments with 20 subjects per treatment:
- With 20 subjects per group, you have a relatively small sample size. This limits the power to detect statistically significant differences between groups. Power increases with larger sample sizes.
- When comparing means/medians, you could use an ANOVA or Kruskal-Wallis test to compare across all 5 treatments. Follow up with pairwise comparisons like t-tests or Wilcoxon tests to see which groups differ. Apply a correction (like Bonferroni) for multiple tests.
*- For ranges, you could compare distributions using visual methods (box plots, dot plots) or statistics like Levene’s test. *
- With small sample sizes, outliers can strongly influence means and ranges. Carefully check your data for outliers. Consider reporting medians which are less sensitive.
- Account for variability from subject-to-subject when conducting your statistical analyses. Since you have repeated oocyte counts within subjects, mixed effect models are ideal to model the within-subject correlation.
- Important variables like age, AMH levels, diagnosis may act as confounders if they differ substantially across treatment groups. Try to match groups on potential confounders in your study design or adjust for them in analysis.
The key is selecting the statistical tests that align with your specific research questions and study design, keeping in mind limitations like sample size and accounting for key variables.
My reaction to the bot is, yeah, that sounds reasonable. Small N suggests low power and confounding variables may be at play.
Re-emphasizing the limitations of this response to the question: I am not a biostatistician and I don’t even play one on TV. The large language model that I consulted, claude.ai, is only a percentage shooter that has composed an answer based on algorithms dealing with words that are related to the subject.
My justification is that questions are always more important than answers because answers always depend on facts and the facts are always changing. But questions that lead to useful answers are stable between paradigm shifts.
I hope that this is helpful in attracting attention to the problem by giving people who actually know what they are talking about a reason to say either yes, but or you fool! don’t you know?
Another suggestion is that screenshots repel, datasets attract. A CSV file of the data posted as a github gist even without an R script to show the Welch results will ease the burden on the boffins who visit here to apply a magic wand to the problem.
This likely exhausts my ability to contribute, but I’m happy to continue as an interlocutor, because I love babies.