Dear all,
I feel confused by when to lump categorical variables.
For example,
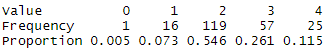
For this case, lump level 0 and level 1 should be fine because level 0 only has 1 patient.
This is another example,
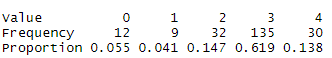
Should I lump level 0 and level 1?
Actually, I am wondering whether there is a criteria/cut-off point to start the action of lumping different levels.
Thank you so much and wish you stay well!
Lingxiao
1 Like
in the bbr course Prof Harrell mentions that the chi-square rule suggesting a cell count of 5 is needed is not correct. You will probably not need to merge cells especially in the case examples you give
1 Like
And we need to know more about the nature of the variable. If it is unordered the the cell frequency is an issue. If it is ordered, it’s not. You can have lots of ordered categories with only one subject in them.
2 Likes
Thank you, Paul!
I checked the Profesor Harrell’s RMS book.
In paper 65, it indicated that Let all categorical predictors retain their original categories except for pooling of very low prevalence categories (e.g., ones containing < 6 observations).
In paper 521, it indicated that For pf we could lump the last two categories
as before since the last category has only two patients.
Thank you so much, Professor Harrell!
In my case, it is ordered.
Actually it is an exposure I want to explore. Thus, should I treat it as an ordinal predictor? For example, use factor function in R: factor (…, order = TRUE).
I checked your book. It seems that ridge regression should be used. But I also have some missing data in my covariates (>5%).
First step is multiple imputation through your Hmisc package. Second step is ridge regression through your rms package. Is it the right thought?
Thank you again and wish you stay well!
That’s a lot of issues and sorry I can’t delve into those. For ordinal predictors that come halfway close to being interval scaled I frequently model them as quadratic. Best to use a Bayesian model. The R brms package automatically handles ordered factors using a prior that allows them to be unordered but that penalizes towards ordering. This is the most rational approach.
1 Like
Thank you so much, Professor Harrell!
I will learn R brms package as you suggested.
But I think I may choose the way you frequently used: one linear term and one quadratic term, which you also mentioned in RMS book. It facilitates testing for linearity, which is easy to explain in the medical manuscript.
Thank you again!
okay. It may not apply, but just for reference:
-section 6.4 http://hbiostat.org/doc/bbr.pdf, or
-about 15 mins in: https://www.youtube.com/watch?v=OCzYODguhRI
2 Likes
I minor note: Allow for nonlinearity, but don’t test it. Testing it tempts analysts to remove nonlinear terms and that would distort inferential quantities.
1 Like
A doubt that arises in my mind about that. If I have an ordinal variable, say with 10 categories, and I use it as a predictor (independent variable), can I use restricted cubic splines?
For example, with the formula rcs(ordered 10-point variable) ??
Or how is the best way to allow for non-linear effects with ordinal variables? Does it depend on the number of levels?
The Bayesian approach is the only really satisfying one (treat it is polytomous then shrink it towards ordinal). Because of heavy ties in the data I have trouble specifying knots and just use quadratic when doing frequentist models.
So quadratic in frequentist model, with a formula such as 10-point-ordered + 10-point-ordered^2 ??.
But how is the shrinking to ordinal specified in the formula of a brms Bayesian model?
Thank you so much, Professor Harrell!
I am wondering whether there is a guideline about how to report these nonlinear relationships. If I want to say the association between exposure and outcome was nonlinear after adjusting confounders, what kind of information should I provide in the manuscript (I knew figure should be provided as you showed in the RMS book)? Should I at least confirm the linear term is statistically significant and then use the quadratic term to model the nonlinear relationship?
Because I will test the association between different ordinal exposures and one outcome, it seems that I should say whether one exposure is associated with the outcome first and then whether the relationship is nonlinear. Or is there any better option? Provide the effet estimate with its 95% CI of the linear and quadratic term (it seems unreasonable)?
Maybe the question is whether there is a criterion that I could conclude the association between exposure and outcome was nonlinear.
I feel a little bit confused by writing the potential results section and the abstract section of the study.
I checked some published papers and found a two-step framework.
- a likelihood ratio test to compare the model with a quadratic term to the model with a linear term, with P<0.05 denoting significant non-linearity
2.If a significant P value was found, further test for overall significance of curve using a likelihood ratio test by comparing the model with a quadratic term to the model only with intercept
I am wondering whether it is a valid way.
see comment above? also elsewhere Harrell has said don’t use p-values for selection
1 Like
Thank you, Paul,
I knew Harrell’s point. For a prediction question, I totally agree with Harrell: directly use the nonlinear term. But if we want to explore the association between one ordinal exposure between an outcome. It is more likely a casual inference question. As Harrell mentioned before, ordinal predictors that come halfway close to being interval scaled. I was thinking about whether it is fine to directly assume the association is nonlinear. If the answer is yes, we still need a criterion to conclude whether nonlinear relationships exist. P-value through the likelihood ratio test seems a widely used way.
You are hung up on some kind of magic criterion to say that something is true. Get past that. Don’t test it. Model from subject matter knowledge. If you think a relationship may be nonlinear then model it as nonlinear and be done with it. You need a parameter in the model for everything you don’t know, otherwise your inference will be over-optimistic. Later you can get into full Bayesian approaches where nonlinear effects are “half in” the model.
1 Like
Thank you so much, Professor Harrell!
I think this time I understand.
Before I master the full Bayesian approaches, I should do it as follows under the frequentist framework:
- model the ordinal exposure through quadratic term;
- plot the partial effect of the exposure;
- describe the findings from the plot.
1 Like