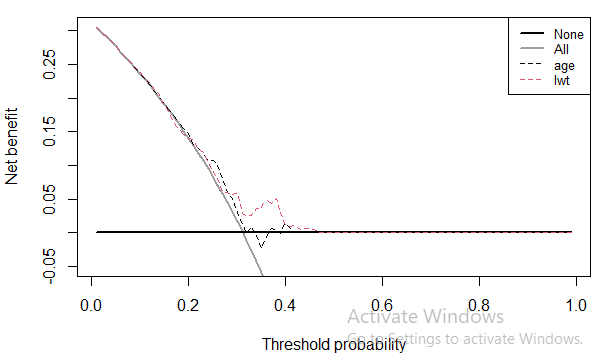
The curve shows the relationship between NB and p_threshold, in the curves the reference line looks like a linear line between (0, prevalence) when p_threshold = 0 and (prevalence, 0) when prevalence / (1 - prevalence) is equal to (p_threshold) / (1 - p_threshold).
If I’m not mistaken, the line must have some curve. Am I wrong?
If you show the full range of the x and y axis, you’ll see the curve. It is pretty linear for parts of the curve. For instance, use the code (this is Stata, but it is similar in R etc):
dca event phat, xstart(.01) xstop(.99) ymin(-10)
The formula for interventions avoided is given in the original MDM publication and is coded in all the software. It just changes the unit. For a conventional decision curve, we report net benefit in terms of true positives. An NB of 0.1 for a model means e.g. “using the model is the equivalent of 0.1 true positives, that is, it is equivalent to a strategy of biopsying 10% of the population and all of them having cancer, with no unnecessary biopsies (i.e. zero false positives).” If a model had a net benefit 0.1 higher than an alternative model, you can say “using model A rather than model B is the equivalent of finding an extra 10 cancers per patient evaluated without any increase in false positives”.
Now, for interventions avoided, the unit becomes “decrease in false positives” rather than “increase in true positives”. So a model that has 10 per 100 more interventions avoided than treat all, you can say that the model is the equivalent to a strategy where you do 10 fewer biopsies per 100 but find exactly the same amount of cancers.