95% CI for proportional meta-analysis to be outside the 0-1 range

Dear Scholars,

I hope you all are well. I have a consultation with you all.
I am a Japanese psychiatrist currently studying at the University of New South Wales in Sydney. My specialty is brain stimulation therapy and I am currently doing a meta-analysis on relapse proportion after electroconvulsive therapy(ECT). And I am doing a proportion meta-analysis in Stata(using ‘metaprop’).

The cochrane handbook does not sufficiently mention proportional meta-analysis, so I wanted to discuss this with you in the hope that I could access the wisdom of the wise here.

Here are the questions

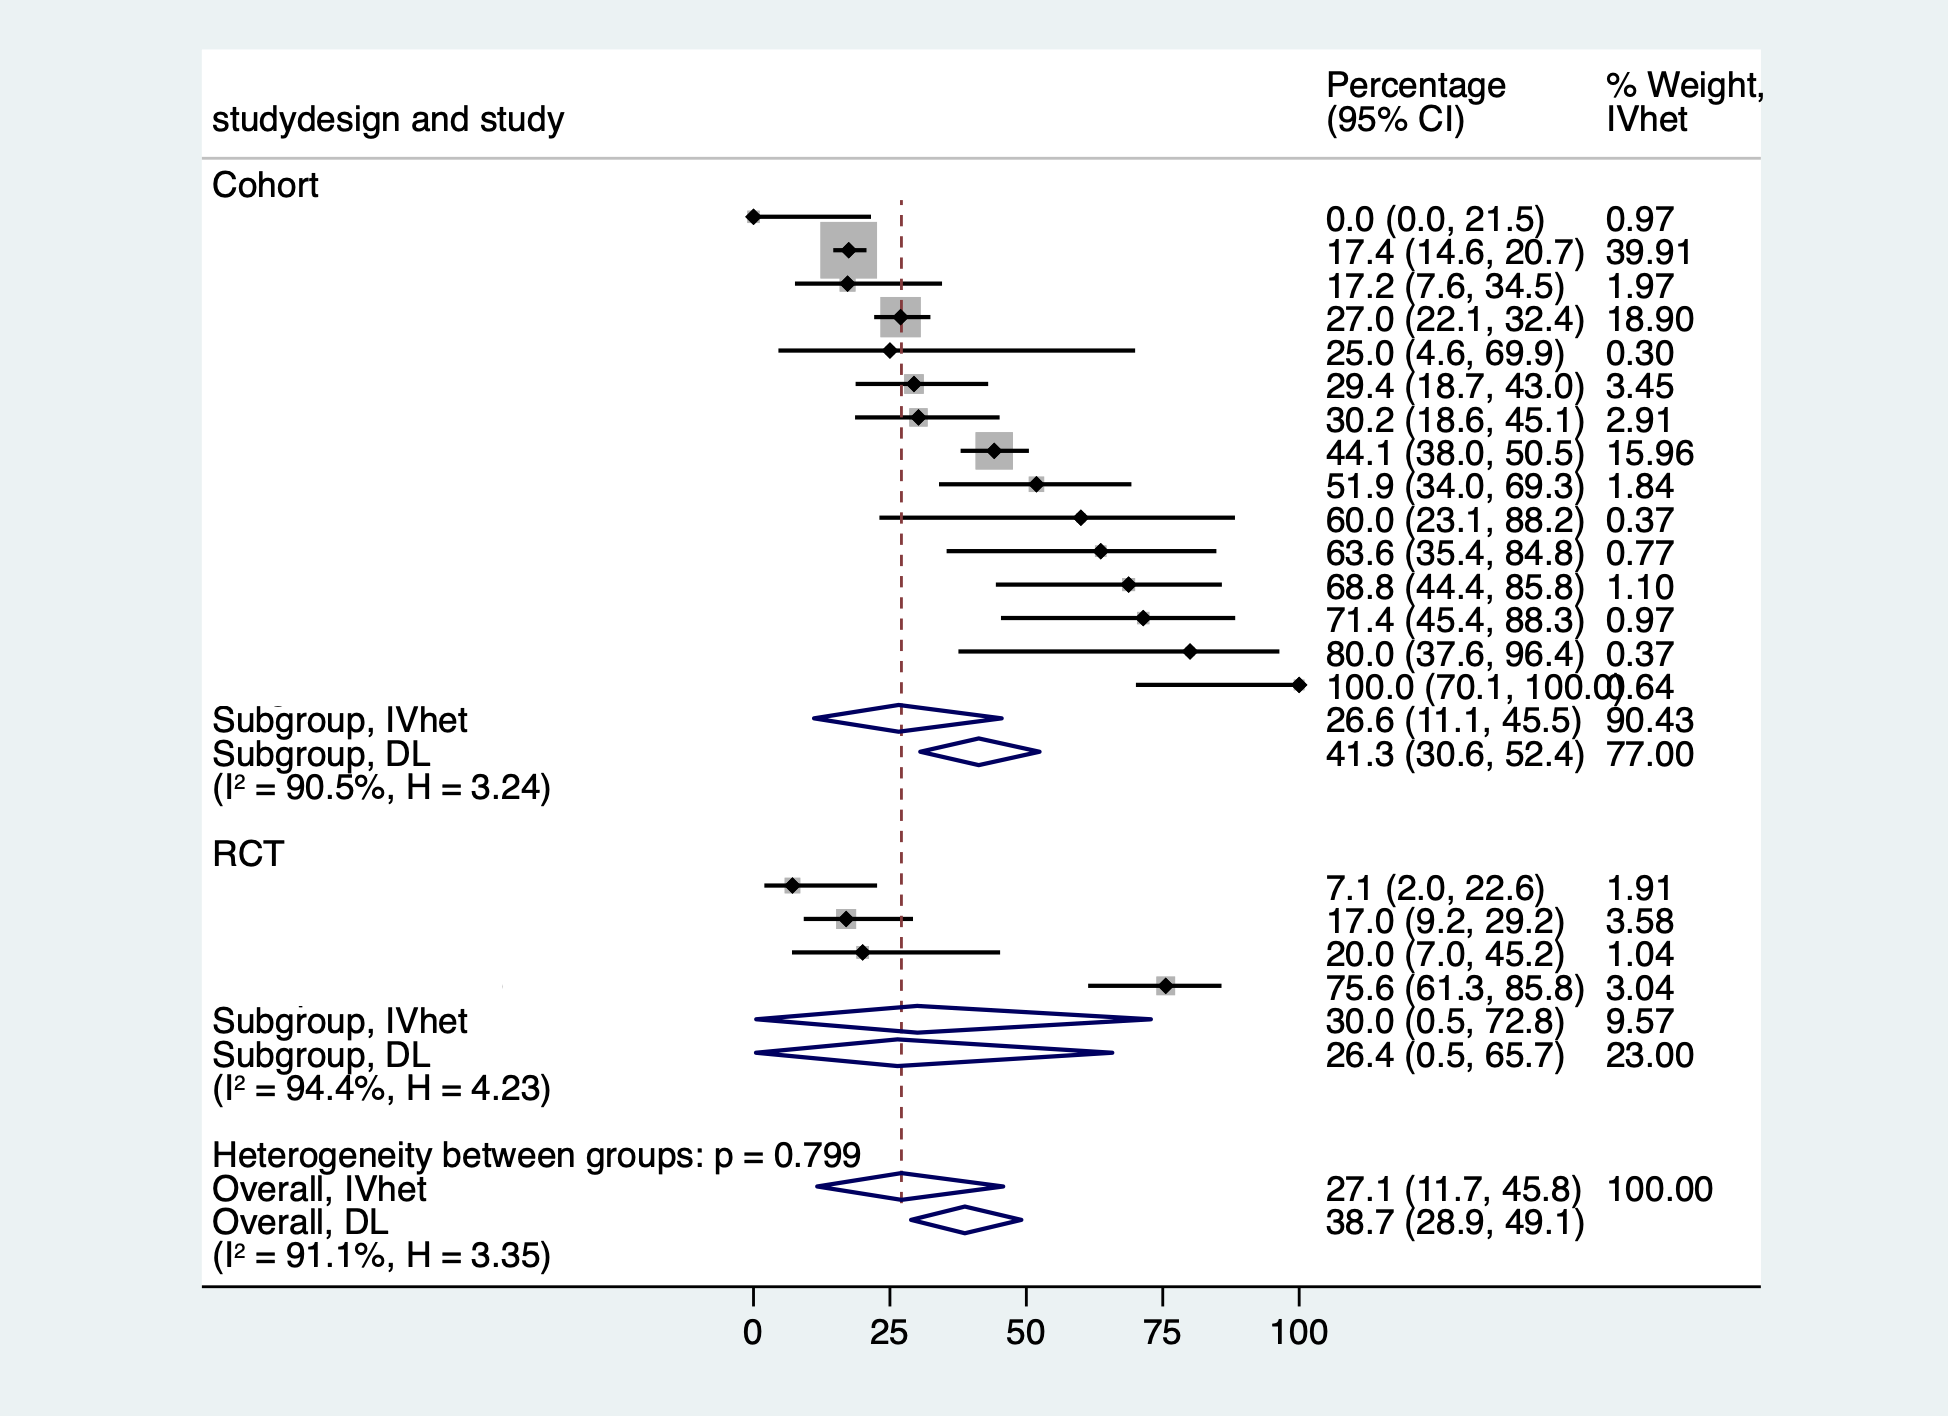
  1. In a subgroup analysis, I am having difficulty interpreting results where the 95 % CI is greater or lesser than 0 or 1. I understand that there is a large bias in this study because it included many cohort studies with small numbers of cases as well as RCTs, but I do not understand why the integrated results exceed 0 or 1.

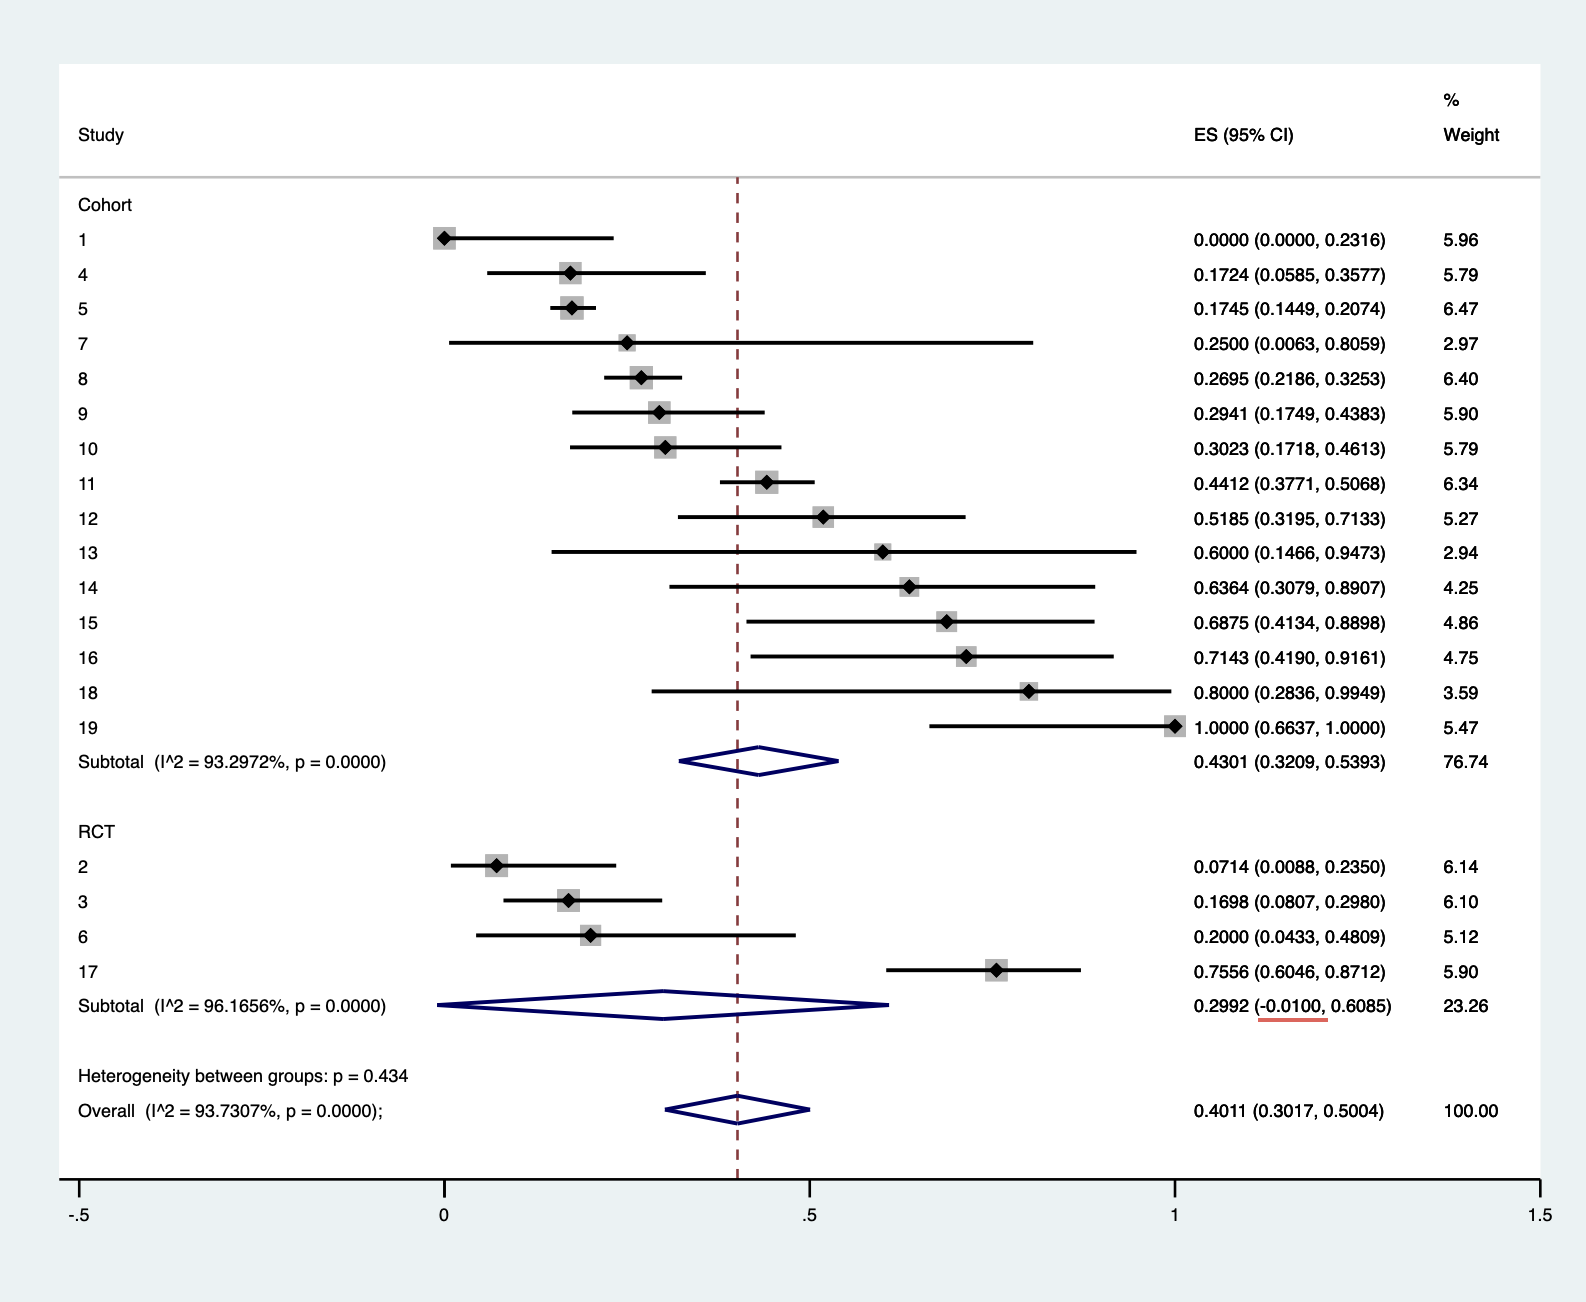
I would like to know if it is a problem that I am using Statat’s “metaprop”.
I have calculated the results using the following formula, based on the literature of Nyaga 2014 .
“Metaprop: a Stata command to perform meta-analysis of binomial data.” Archives of Public Health 72 (2014): 1-10.

metaprop case population, random by(studydesign) cc(1) dp(4) cimethod(exact) label(namevar=study) sortby(_ES)
xlab(0,.25,0.5,.75,1) xline(0, lcolor(black))
xtitle(Proportion,size(3)) nowt nostats
olineopt(lcolor(red) lpattern(shortdash))
diamopt(lcolor(red)) pointopt(msymbol(s)msize(2))
astext(70) texts(100)

  1. In proportional meta-analysis, there is no scale to assess heterogeneity and some papers do not report it or alternatively use I^2.

In this study, I refer to a proportional meta-analysis on the service life of the hip published in the Lancet.
Evans, J. 2019. How long does a hip replacement last? A systematic review and meta-analysis of case series and national registry reports with more than 15 years of follow-up. The Lancet , 393 (10172), pp.647-654.

This article did not report on heterogeneity (partly because it was a nation-wide study and had a large sample size), but ECT studies are characterised by few studies with sufficient samples, partly because of the difficulty in designing RCTs. In such cases, we would be grateful for your opinion on how meaningful it is to report heterogeneity and to perform meta regression.
It is possible to perform meta regression when using R. However, this was not recommended in the paper that mentioned proportional meta-analysis with R tools.
Wang, N. (2017). Conducting meta-analyses of proportions in R. Research Gate: College Station, TX, USA .

3.How meaningful is it to assess publication bias in proportional meta-analysis.If you use R, you can create a funnel plot, but the included studies are not comparative studies, but are created with results consisting of non-traditional binary data I would like to know if there is really any significance in a funnel plot.

This was also not recommended in the papers that mentioned proportional meta-analysis with the R tool.
Few previous proportional meta-analyses have reported funnel plots or meta-regression.
We would like to know if this is because there is not much significance to this as well.
I am truly sorry for submitting such a long question.
Thank you for reading the post, and I look forward to hearing from some scholars soon!

Kind regards,

Regarding 1. I have just received a response from Nyaga when I discussed this with him. It was because I forgot to perform the Freeman-Turkey double arcsine transformation. Apologies for this, I have not been able to find the correct answer to your question.

I basically think that FTT is the most preferred method in the current situation, but I think there has been a previous discussion on this topic in this group. I would be grateful for your advice on those as well.

Before drawing conclusions, read this thread, especially this post, with references to the most recent literature.

1 Like

Thank you for the very useful information on the evolutionary process regarding the interpretation of the use of the FTT as a proportional MA. I am glad I consulted you.
My upgrade stopped with Doi’s comment to Schwarzer in 2021.

I checked Rover’s paper in 2022 and found the cited paper on double and single arcsine transformations very informative (Lin 2020, 2022). I will check the differences in the overall proportion estimates produced by the analysis methods in my own research.

I am very sorry for the basic question, but I am having trouble understanding the command for single arcsine transformation in Stata (metaprop). If you know it, I would be grateful if you could tell me.
If I were to run it, would it be better to use the updated metan instead of metaprop?

Thanks

This would only happen when the proportion was not transformed before meta-analysis or if the wrong transform methodology was used (metaprop has an incorrect back-transform for pooled proportion on the FTT scale and therefore metaprop should NOT be used (as stated in my rebuttal paper to Schwarzer et al).

I see no problem with using I2 or similar measures

You cannot use the funnel plot for the proportion effect size even if transformed (see this paper). Best to use the Doi plot available in the Stata package doiplot which you can install by typing
ssc install doiplot

You are right that FTT is probably the best of the transforms available and both the Schwarzer and Rover papers are not really right about the issues with the FTT. I have already rebutted the Schwarzer paper (as you have noted) but have not had time to do so (yet) with Rover. The issue I believe raised by Rover is true but possibly non-consequential for researchers implementing the transform so you need not worry about it

Most certainly you should migrate to metan and drop use of metaprop as the Barendregt-Doi correction has been applied to metan. I have listed an example code (with dataset from Schwarzer below - just copy all the code below and paste into Stata)

clear
input str3 studyname long n int cases byte qi
“S1” 217154 422 1
“S10” 16557 32 1
“S13” 676 1 1
“S18” 44 1 1
“S26” 29 1 1
end

metan cases n , pr model(ivhet \ re ) transform(ftukey, iv) study( study ) forestplot(astext(85) textsize(120) boxscale(55) spacing(1.2) leftjustify range(0.1 7) dp(3)) denom(1000) extraline(yes) hetinfo(isq h)

1 Like

Dear Suhail Doi,

I apologise for the delay in replying.
I needed time to make my own interpretation of the points you raised.

It is an honour to receive comments from a great researcher such as yourself.
I have read your correspondence with David about your significant contribution in this area and the efforts you have made to implement it in Stata. I respect you wholeheartedly.

The ftt in Metaprop used a random effect model (REM) and there was a considerable difference in the distribution of weights compared to the results in metan IVhet. This difference and the approximation of the final result is very interesting, but unfortunately I have to say that with my insufficient knowledge it is still difficult to give a clear interpretation.

metaprop ftt REM
metaprop case population, random by(studydesign) ftt dp(4) cimethod(exact) label(namevar=study) sortby(_ES)
xlab(0,.25,0.5,.75,1) xline(0, lcolor(black))
xtitle(Proportion,size(3)) nowt nostats
olineopt(lcolor(red) lpattern(shortdash))
diamopt(lcolor(red)) pointopt(msymbol(s)msize(2))
astext(70) texts(100)


Sorry, I have not converted to percent!

metan ftt IVhet
metan case population , pr model(ivhet \ re ) by(studydesign) transform(ftukey, iv) study( study ) sortby(_ES) forestplot(astext(65) xlab(0 25 50 75 100) textsize(120) boxscale(55) spacing(1.2) leftjustify range(0 100) dp(1)) denom(100) extraline(yes) hetinfo(isq h)

Indeed, as you say, the meta-analysis study is representative of the whole population and cannot be randomly selected from a fictitious normal distribution as in a simulation, so I could understand the need for the IVhet model. Many researchers use REM without due consideration.
In this regard, I hope that one day clear guidance will be provided for many biostatisticians or clinical researchers, in line with each study case.
Thank you very much for signposting so clearly and giving me such a great learning opportunity.
I will do my best to live up to your great wisdom in enabling clinicians like me to take hold of your hands and look into a new world.

I am truly sorry that this is a very fundamental question, but what does DL indicate?

Sincerely regards,
Nobuatsu Aoki

Nobuatsu, thanks for your kind words but I am sure there are more experienced people on the blog that can also pitch in. The advantage I have is that I am wearing the clinicians hat so that makes it easier to speak with fellow clinicians like you

Regarding the two outputs - the first one above is the random effects modelling and what immediately can be observed is that because heterogeneity is large, the weights default to equality and the model defaults to the arithmetic (or natural) mean. This is bad because the purpose of weights in meta-analysis is to trade off bias against a larger decrease in variance thus minimizing the mean squared error. Unfortunately there are still methodologists who believe that unbiasedness should be a property of a meta-analytic estimator but that is incorrect.

Coming to the second analysis using the IVhet model, you can clearly see that the variance weights are respected and that overdispersion is addressed without equalizing the weights. DL stands for DerSimonian and Laird’s method for the random effects model developed in 1986 and which is the most commonly used random effects model in meta-analysis today. The comparison meta-analytic estimate is shown in the plot against the IVhet so you can see how they differ. Note that the results in the metaprop output is also DL but differs slightly from the metan output because the back transforms are different.

1 Like

When you have such significant heterogeneity it is interesting to explore what might be causing this. Although you will not be able to confirm the cause in a meta-analysis it could stimulate further research to confirm the reason for differences in relapse. The forest plot can be of some help. You could plot studies in sequential order by year or subgroup by country for example. I recall looking at the diagnostic accuracy of so called “blood biopsy” for the diagnosis of pancreatic cancer. There were a number of variables including the country where the study was conducted that led to different values for accuracy. Those were demonstrable with subgrouped forest plots. Unfortunately unless you have IPD then you can only compare study level variables. Also significant heterogeneity seems to be inevitable when you synthesize observational studies.

1 Like

Much of what @llynn wrote in this thread would also apply to psychiatric syndromes, but it depends upon the specific question asked.

3 Likes

Dear Suhail, I see it stood for DerSimonian and Laird! Thank you for pointing me in the direction of this really basic point. I sincerely appreciate this valuable learning opportunity.
Nobu

Thank James for your excellent point.
We are on the same page.
Regarding the high heterogeneity, I think it is a fate for this kind of proportional meta-analysis.
Thank you also for your advice on subgroup analysis. That point is very useful and so far we have calculated the proportion of recurrences by diagnosis, by region and by maintenance therapy.

The lack of IPD is a limitation of the study. In fact, I would like to include more IPDs to get closer to the real world.

Thank Robert, for giving me such an informative sled (@llynn).
I was struck by the phrase ‘mathematically qualified science relying on statistics’.

It is also something that many clinicians can sense that the dissociation from the real world designed in RCTs is part of the reason why they cannot be the signposts we seek.

I keep pushing forward in a confused way.