We are designing a study to understand how radiation doses to small bowel blood pool affects the risk of lymphopenia (reduced lymphocyte count) during radiotherapy (See protocol here).
Problem Statement
Lymphocytes are highly sensitive to radiotherapy and we know that lympocytopenia during radiotherapy is associated with poorer outcomes across multiple solid cancers. The reasons are not very clearly understood and as most of the studies are retrospective multiple sources of bias are possible. Nonetheless avoiding lymphocytopenia is useful in itself as it also reduces the risk of infections (esp viral / fungal) during treatment.
In patients of cervical cancer who receive radiotherapy, lymphocytopenia is nearly universal after radiotherapy. Specialized radiotherapy techniques like bone marrow sparing radiotherapy prioritize saving the bone marrow from radiotherapy (especially the pelvic bone marrow). Randomized trials investigating bone marrow sparing radiotherapy have demonstrated that while this reduces neutropenia (reduced neutrophil counts), lymphopenia does not change. Mechanistically this is not surprising as in adults only 2 - 3% of the total lymphocyte pool will be in the bone marrow.
Evidence from other cancer sites (e.g thoracic cancer) suggests that lymphopenia during radiotherapy may be related to the irradiation of the blood as it circulates to the organs like lung, heart etc. In case of cervical cancers the organ where the maximum blood flow is seen is the small intestine (approximately 11% of the total cardiac output).
The surprising thing is that till date no one actually investigated the impact of irradiation of the small bowel blood pool on lymphopenia.
Study Objective
To determine if radiation doses to the small bowel have an impact on the lymphocyte count of the patients during treatment.
Measurements
Lymphocyte counts are measured once before starting radiotherapy and then weekly during treatment (usually 5 - 6 measurements till the treatment completes).
Doses to the organs like bone marrow and small bowel will be available as a dose matrix and we can obtain various dose parameters like average dose, median dose as well as dose volume data. At the starting stage we will consider a simple assumption that dose to the small bowel is a surrogate of the blood pool doses in the small bowel.
Other factors that can influence this toxicity
There are several other potential factors that can influence this toxicity like:
- Age
- Menopausal status
- Height and weight (these determine the total dose of chemotherapy delivered during treamtent and also influence the volume of tissue receiving radiotherapy)
- Chemotherapy dose (patients receive chemotherapy weekly and each week the dose of chemotherapy (cisplatin) affects the lymphocyte count)
- Bone marrow dose
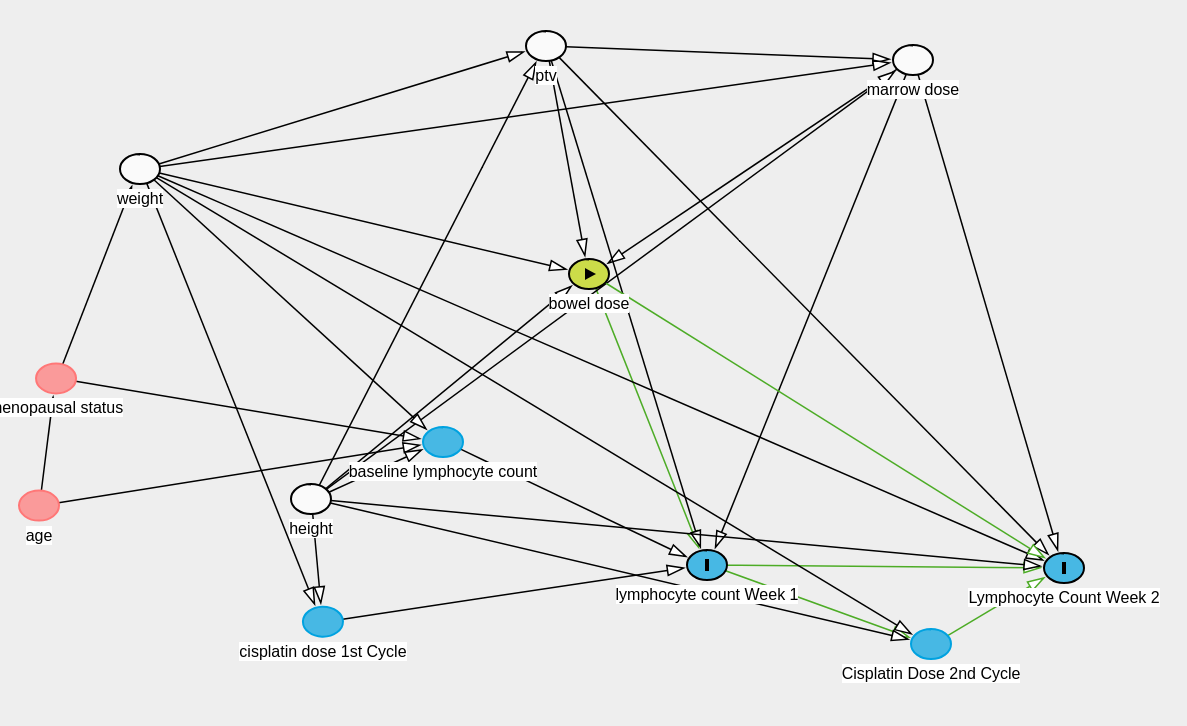
We have made the following causal diagram:
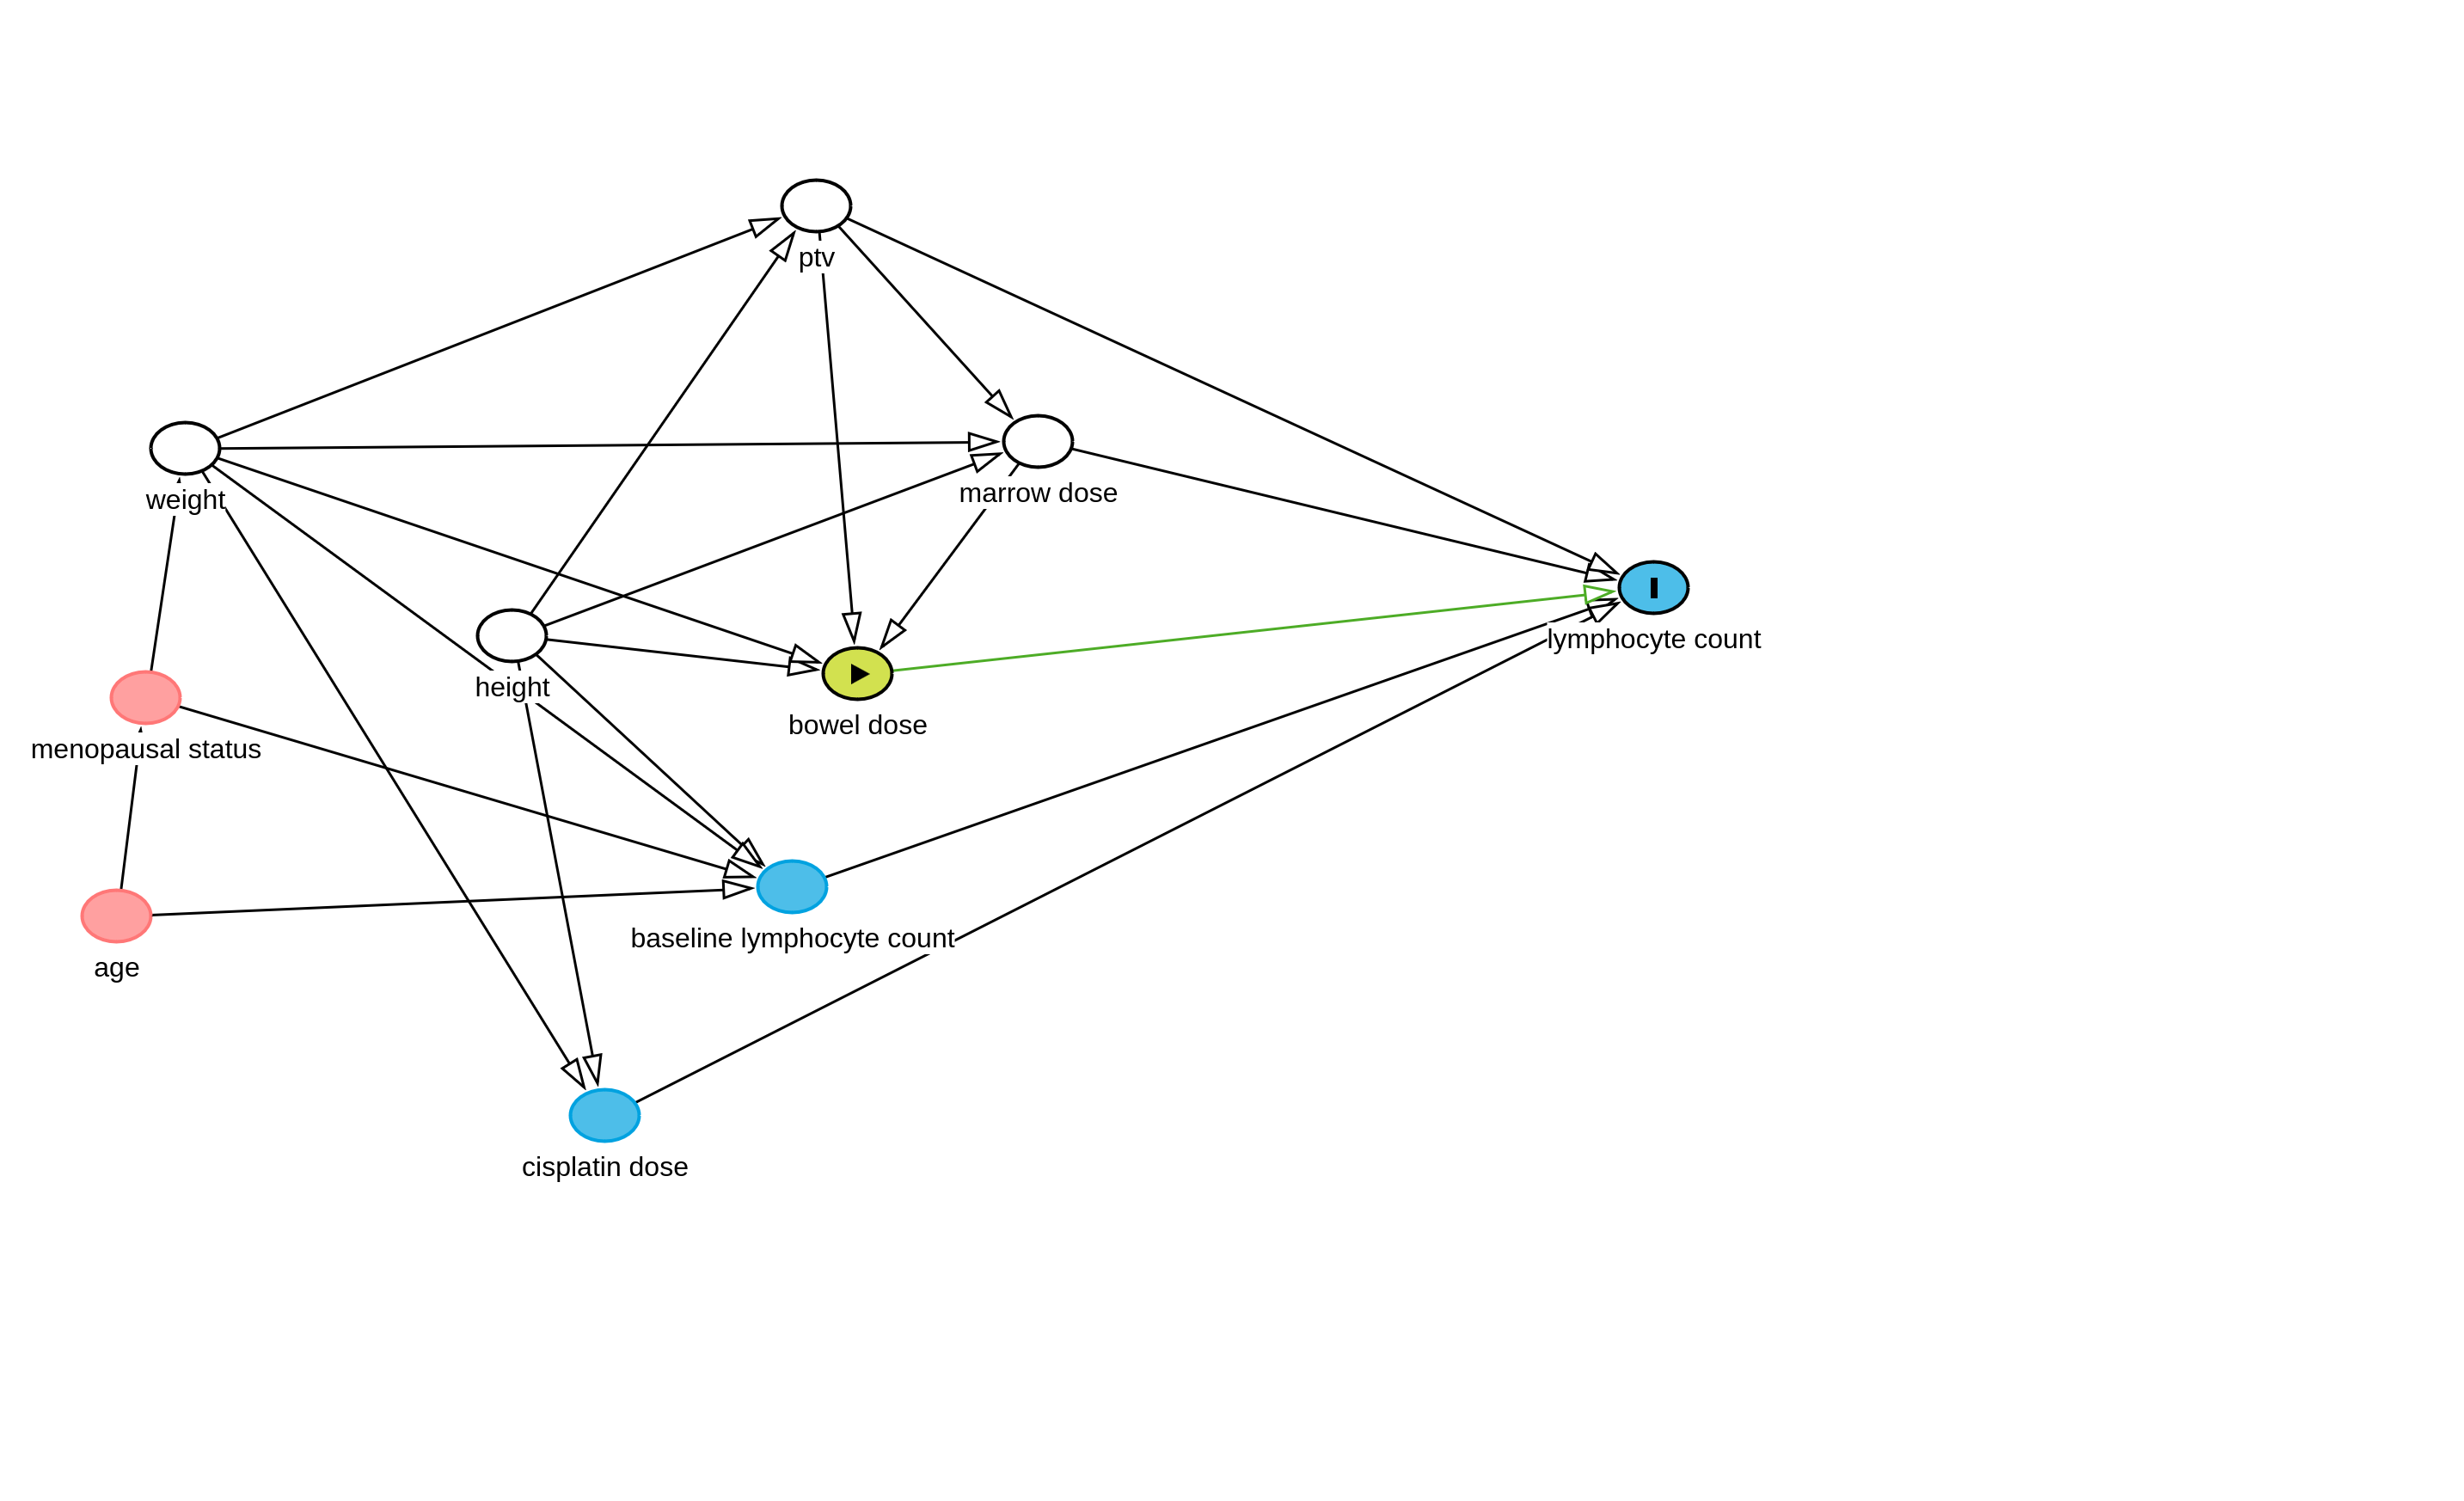
As lymphocyte counts are repeating data they will depend on the baseline lymphocyte count (patients with pre-existing lymphopenia likely to have greater lymphopenia in the future), radiation dose to the bone marrow (this has a strong mechanistic basis), and potentially the radiation dose to the small bowel which we are interested in.
We know that height and weight directly influences the total dose of cisplatin administered as we calculate the dose of the drug based on body surface area. Additionally height and weight determine the dose to the bone marrow and the bowel (radiation physics).
PTV is planning target volume (ie. the volume of the tissue we are treating to take care of the cancer) and this is dependant also on the height and weight.
Age and menopusal status can influence weight and may influence the baseline lymphocyte count.
Proposed analytical methodology
A linear mixed model where the cluster variable is patient ID, fixed variables are PTV, height, weight and baseline lymphocyte count. Dependant variable is the weekly lymphocyte count.
Conditional independencies will need to be checked as per the DAG.
Question
As per the DAG, the regression model needs to adjust for the ptv, height, weight and bone marrow doses. While cisplatin dose is important the DAG indicates that we do not need to adjust for it if we can demonstrate the conditional independance. However, cisplatin is given weekly and the dose delivered on each week will be determined by the presence of hematological toxicity. Now we do not adjust the dose of cisplatin or hold cisplatin based on the lymphocyte counts per se but it is likely that a person with severe lymphocytopenia may have other hematological toxicities or secondary infections that prevent us from giving cisplatin. In other words the lymphocyte counts can potentially influence subsequent cisplatin doses as shown in the illustration below.
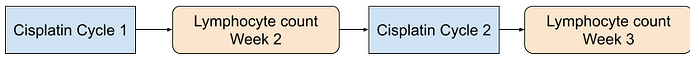
I understand that in this case seperate DAG should be built for week 2 lymphocyte count, week 3 lymphocyte count etc to account for this temporal relationship but how should we model this relationship. One way I have thought of is to consider cisplatin dose and weight for each week as a random variable and include it in the linear mixed model. Is this the correct way or should I use another method.
Also I would appreciate feedback about the overall design and how I should approach the sample size calculation.
DAG model code for DAGITTY
dag {
bb="-5.478,-5.027,4.025,5.389"
"baseline lymphocyte count" [pos="-2.421,1.130"]
"bowel dose" [exposure,pos="-2.169,-0.350"]
"cisplatin dose" [pos="-3.144,2.716"]
"lymphocyte count" [outcome,pos="0.902,-0.947"]
"marrow dose" [adjusted,pos="-1.473,-1.961"]
"menopausal status" [pos="-4.914,-0.183"]
age [pos="-5.027,1.332"]
height [adjusted,pos="-3.502,-0.612"]
ptv [adjusted,pos="-2.328,-3.595"]
weight [adjusted,pos="-4.762,-1.913"]
"baseline lymphocyte count" -> "lymphocyte count"
"bowel dose" -> "lymphocyte count"
"cisplatin dose" -> "lymphocyte count"
"marrow dose" -> "bowel dose"
"marrow dose" -> "lymphocyte count"
"menopausal status" -> "baseline lymphocyte count"
"menopausal status" -> weight
age -> "baseline lymphocyte count"
age -> "menopausal status"
height -> "baseline lymphocyte count"
height -> "bowel dose"
height -> "cisplatin dose"
height -> "marrow dose"
height -> ptv
ptv -> "bowel dose"
ptv -> "lymphocyte count"
ptv -> "marrow dose"
weight -> "baseline lymphocyte count"
weight -> "bowel dose"
weight -> "cisplatin dose"
weight -> "marrow dose"
weight -> ptv
}