AKI is both more and less than acute kidney injury

Responder analysis is a most problematic statistical analysis. General problems with responder analysis are described here. Analysis of acute kidney injury (AKI) as a binary outcome is one example of responder analysis. Any time that a binary response is created from an ordinal or continuous response, information, power, and precision are lost, sample size is needed to be greatly increased, and the analysis is afflicted by arbitrariness. It should be noted that if clinicians are interested in the probability that an underlying continuous response will fall below or exceed a certain cutoff, such probabilities can readily be computed from the continuous or ordinal response model, and these probabilities are more precise than those estimated from a binary logistic model on the forced binary response.

A standard definition of AKI is the presence of any of three conditions:

  1. increase in serum creatinine (SCr) by \geq 0.3 mg/dl within 48h
  2. increase in SCr to \geq 1.5 \times baseline
  3. urine volume < 0.5 ml/kg/h for 6 hours

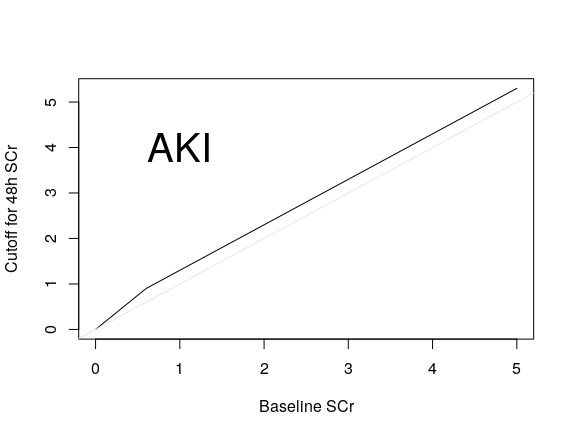
For this discussion let’s consider just the SCr components. First let’s better understand what the (unnecessarily binary) AKI designation means. The following plot shows the region in the baseline and follow-up SCr space that qualifies a patient to be labeled as AKI, i.e., it shows the lower limit of the second SCr measurement that qualifies a patient as AKI, as a function of baseline SCr. You can see that condition 2. is virtually ignored, as the increase of SCr by 0.3 is a much more relaxed condition than requiring an elevation to 1.5 \times the baseline SCr. The gray scale line is the line of identity.

Rplot

Besides losing all information about the amount of kidney injury, conditions 1. and 2. above suffer from three serious problems:

  1. SCr does not change in either an incremental or ratio fashion
  2. The relationship between SCr and mortality is not monotonic; very small SCr is detrimental to health
  3. Once SCr is updated with a later measurement, the baseline SCr becomes almost irrelevant. The patient’s ultimate prognosis is determined primarily by the most recently measured SCr (plus urine output and other physiologic measures and age)

A prime requirement for a proper response variable is that it mean the same thing to different patients. AKI fails this test, because to undo the undue influence of baseline SCr, one must interact AKI with baseline SCr in order for it to correctly relate to prognosis.

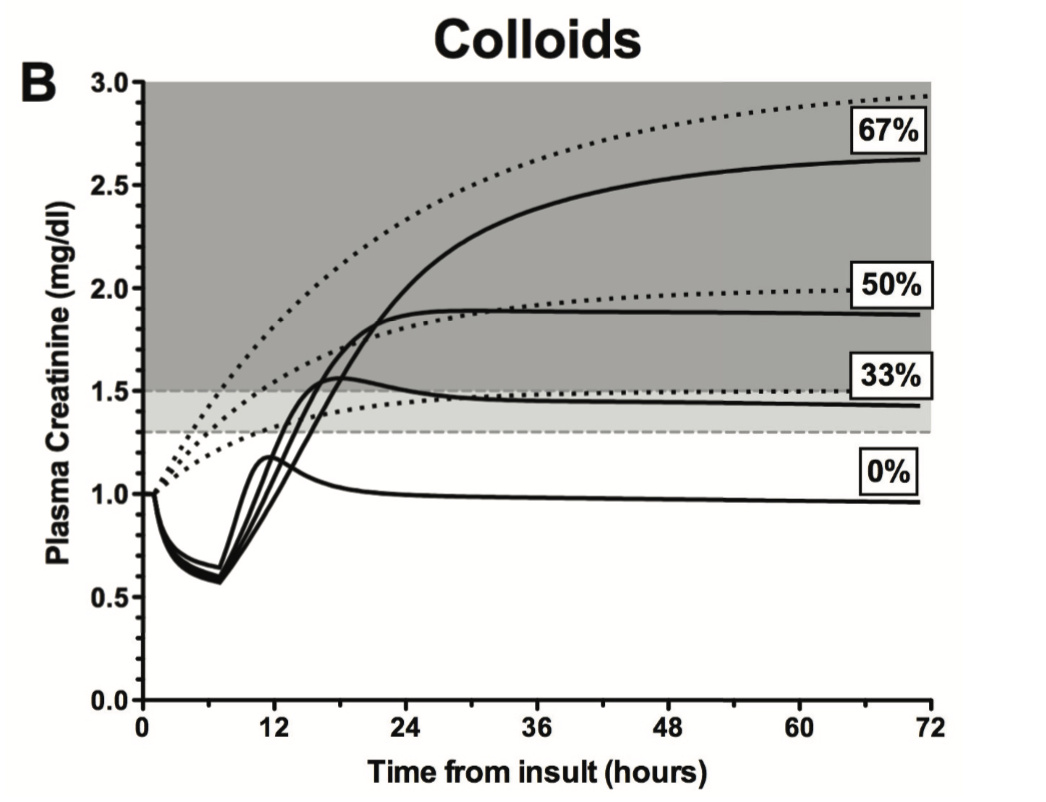
To illustrate point 2. above, consider the following figure from BBR Section 14.4.2.

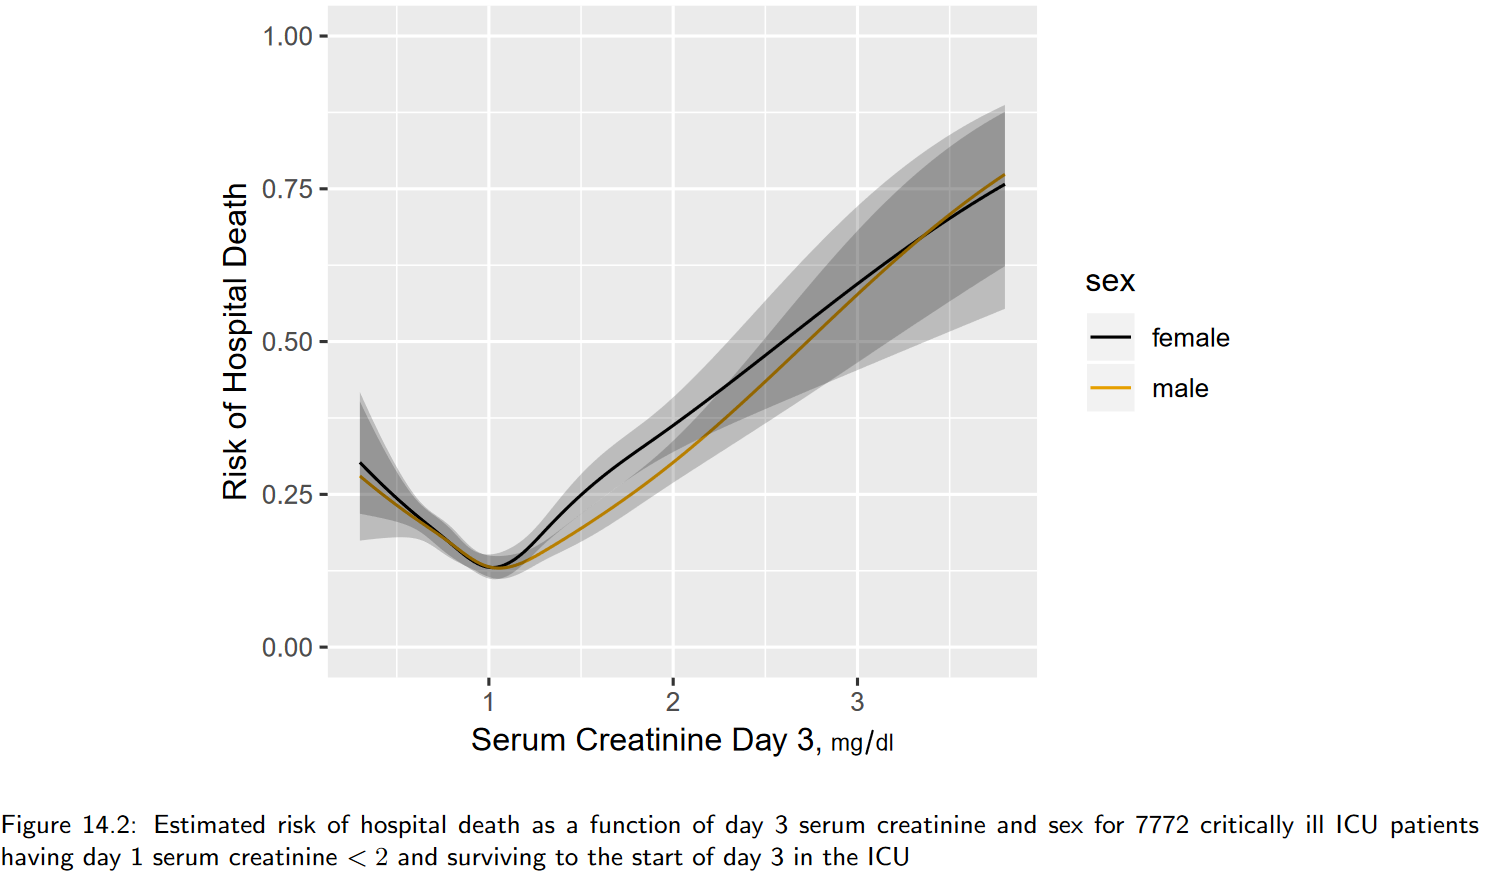
To illustrate point 3., consider the same section in BBR where risk of death in hospital is estimated for critically ill hospitalized adults on the basis of a smooth nonlinear function of day one SCr and a smooth nonlinear function of day 3 SCr for patients surviving at least to the start of day 3. Here are the adjusted Wald \chi^2 statistics assessing the prognostic importance of the baseline and updated SCr:

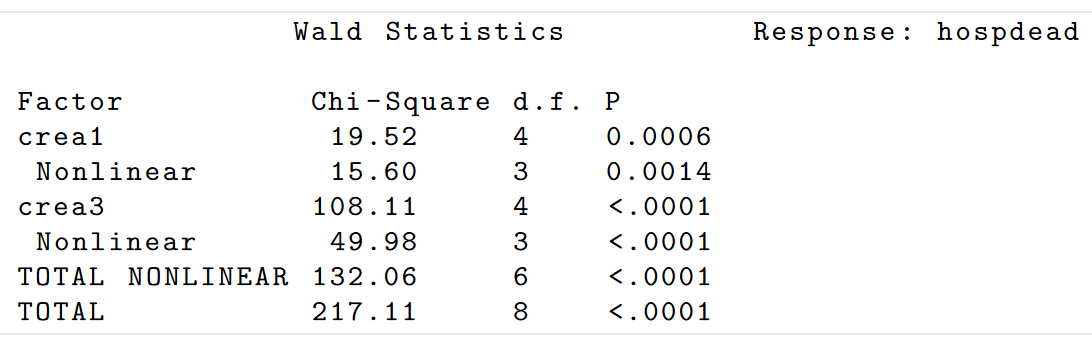
One can see that the prognostic influence of baseline (day 1) SCr is almost negligible. Critically ill patients’ prognoses depend almost solely on current levels of organ damage, not on how the patient got there.

The central focus on therapeutic comparisons should be to answer the following question: To what extent do two patients who are alike at baseline save the treatment assignment end up with different outcomes? In the setting of AKI we should ask what is the ultimate renal function given the baseline level of renal function. So envision a general regression model that predicts day 3 SCr from a restricted cubic spline in day 1 SCr with 5 knots (requiring one linear and 3 nonlinear terms).

When renal function is the outcome variable, a semiparametric ordinal model such as the proportional odds model has special benefits. It would allow a “rapid deterioration requiring dialysis” override as the highest ordinal level, as in BBR Section 4.1.2:

Note that if change or log ratio of SCr were used as the response variable instead of using the final SCr, one would have more difficulty knowing where to place dialysis on the outcome scale. A large change in SCr may still result in a final SCr that is not as bad as needing dialysis.

By predicting follow-up SCr from a flexible function of baseline SCr, one can estimate the probability of exceeding any desired change or ratio, and make it completely transparent that this probability must depend on baseline SCr.


For More Information

7 Likes

Thank you Frank, this is most helpful. A couple of other considerations:

  1. The definition of AKI is a rapid loss of renal function - this means the SCr & UO definitions are mere surrogates (& not great ones). So even before we get to model them we have lost a lot of information (eg about the true extent of loss of GFR & about the individual’s renal reserve). I’ve bemoaned in the literature that after the RIFLE defintion the nephrology community dropped a delta GFR from the AKI definition & stuck with SCr and UO only (I expect because it is so darn difficult to measure).
  2. In addition to the use of SCr as a continuous variable I think what is needed is to include a measure of the rate of change. Physiologically two people with identical baseline SCr and identical elevated SCr will have had a different loss of GFR & quite possibly a different risk of death, if the elevated SCr is measured at a different time post onset of injury.
  3. An elevated SCr in population studies suggests poor outcomes, but even if it and the rate of change is identical between individuals it does not imply that at the time of measurement they have identical GFR. This is because SCr changes are always delayed following GFR changes. I’ve found a crude way to predict if SCr will fall or continue to rise (using UO + urinary Cr), but think more could be done. Nephrologists making decisions about fluid loading, dialysis etc may find predictions of where SCr is heading helpful. Any ideas?

Excellent points John. We seem to be stuck with a stand-in for rapid loss of renal function. A general question - can you think of many other disease manifestations in medicine that are judged by a rate of change vs. using the current state?

I need data to convince me that rate of change is that important, compared to emphasizing current function.

My main points are that if SCr is the sole measurement used in the determine of AKI, we should not use the binary AKI designation but should instead make optimum use of SCr.

In ICU patients, SCr is more prognostic that eGFR, and eGFR seems to overcorrect for age and sex.

2 Likes
2 Likes

Not of the top of my head … but

I guess I’m arguing on the basis of the physiology. Have a look at the attached from an old paper of mine. Ignore the solid lines as they include the effects of fluid dilution on SCr concentration. The dotted lines are what are interesting. The labels 67%, 50%, 33% are the drop in GFR. If we take, say, SCr at 1.5 we see that there is quite a difference in time. I think, therefore, that if we relied only on 1.5 to model risk then we would get the same answer for all, yet clearly there are differences in loss of renal function.

I certainly agree wrt to your main points and also with eGFR… it shouldn’t be used in ICU (although there is a variant - the kinetic eGFR which has potential).

1 Like

This is a great example. Plenty of patients can come in talking and coherent with a serum sodium of 115 while someone else can be confused and lethargic at a sodium of 125; the difference is how quickly they got there (and then, the speed of correction also matters).

Another example is systolic hypertension. Some elderly patients can live well with a systolic in the 170-190 mm Hg due to slowly increasing arterial stiffness. Take a 30 year old woman who’s pregnant (and with pre-eclampsia, for our example) and give her a systolic of 180 and her ears are ringing, she’s got blurry vision, and she has a headache.

Rate of change can be clinically meaningful.

3 Likes

Thank you all for the great insights that can potentially be generalized to many problems in biomedical research.
From a physician perspective, the rate of change is key to evaluating many clinical and laboratory abnormalities and can likely provide useful – diagnostic or prognostic – information.
A skilled physician will always look at the longitudinal picture (all values across time, e.g. known baseline value prior to admission, and all values since admission), not at a single value. In real life though, the rate of change is rarely formally evaluated or calculated. Often it is visually appreciated by simply plotting the variable values over time.

A non-comprehensive list of examples beyond the creatinine serum concentration where looking at the rate of change is almost always useful:

  • Fever, heart rate, respiratory rate…
  • Most electrolytes abnormalities (Na+, K+, Ca++, phosphorus). One important particularity is that the relationship in this case is U-shaped (i.e., both low and high concentrations are associated with mortality)
  • Coagulation tests
  • Liver function tests, particularly transaminases and bilirubin levels (e.g. acute hepatitis)
  • CRP
  • Cancer-related biomarkers (e.g., LDH, β2 microglobulin, CA19-9)

What are the best methods to look at the rate of change?
I have found some interesting approaches using Bayesian longitudinal joint models (see this vignette by Sam Brilleman https://cran.r-project.org/web/packages/rstanarm/vignettes/jm.html)
Has anyone used this before? Are there useful (simpler?) alternatives?
Apologies if I’m steering this thread astray!

2 Likes

Hi Jordan. I think that for the majority of the variables you mentioned, the current value is more important than the rate of change. But the way to answer this on a variable-by-variable basis is to have a large outcome dataset with serial measurements and to predict the ultimate outcome as a function of the baseline and last measurement in the qualification (landmark) period. The typical result is that the last value gets more than 3\times the weight of the baseline value.

1 Like

Don’t know how this figures into the “responder analysis” question, but it seems important to consider why having a definition of AKI is important clinically. We use the AKI definition to help us with differential diagnosis, which, in turn, helps with prognosis. Patients who lose renal function abruptly often have a worse short-term prognosis than those with a similar degree of renal compromise that has developed over a long period of time. And it’s often the underlying cause of an abrupt creatinine elevation (rather than the creatinine level or renal function itself) which is the most important consideration with regard to prognosis.

In patients whose renal function has deteriorated quickly (e.g, over hours or days), we consider a very different list of potential underlying causes, compared with patients whose renal function has deteriorated more gradually (over months or years). I will be much more worried (at least in the short term) about a patient whose creatinine has increased from 100 to 300 over the span of a few days than a patient whose creatinine has been 300 for the past 3 years.

Consider three patients, all starting from the same baseline creatinine, all of whom experienced a similar increase in creatinine over a similarly short period of time. The first patient’s abrupt creatinine increase was caused by acute urinary retention- his creatinine fell very quickly after insertion of a urinary catheter and he was fine. The second patient had an acute MI and experienced a brief episode of hypotension, leading to acute tubular necrosis which resolved over the next couple of weeks with supportive treatment. The third patient was admitted to the ICU with sepsis and hypotension leading to acutely increased creatinine. In spite of valiant efforts, his hypotension is sustained and he ultimately passes away due to multi organ failure. All three of these patients achieved a similar creatinine over a short period of time, but, if asked, at the time the marked creatinine elevation was first noted, and knowing the underlying cause in each patient, I think most/all physicians would anticipate that the sepsis patient’s prognosis was the worst.

So in the above cases, simply knowing the rate of change of creatinine or the absolute creatinine itself would not have been sufficient for us to estimate the patient’s prognosis.
I don’t know if these points are useful or not…

1 Like

This clinical information is extremely useful. Still I don’t know why a binary designation should apply. And if the definition is only using baseline and new SCr, then providing the physician with (SCr1, SCr2, time lapse between 1 and 2) would generalize AKI, allow measurement of the matter of degree, and would not be arbitrary. I’ll bet that to this day the standard AKI definitions have never been validated.

So what I’m hearing is that, from a statistical standpoint, if something that we can measure (e.g., serum creatinine) contributes to prognosis, then we should try to use as much of the information we have about that parameter as possible when we’re studying prognosis. Since the definition of AKI includes a criterion that effectively “dichotomizes” this parameter (i.e., increase >1.5x baseline or not), the AKI definition is not ideal for the purpose of prognostication. For example, two patients, one of whose creatinine increases from 100 to 300 and the other whose creatinine increases from 100 to 600 over a certain number of days may have very different prognoses. Therefore, lumping these two patients together under the “AKI” heading in a study examining AKI prognosis will obscure this important prognostic difference. Furthermore, since two patients who experience a similar increase in creatinine over a similar short time frame may have very different prognoses depending on the underlying cause of the change, the “rate of change” criterion also might not be optimal for prognostication.

Coming back to the AKI definition itself, I guess “validity” here would refer to whether the three criteria above accurately identify patients who have sustained more than a certain amount of organ “damage” over a relatively short period of time. Even though I can see why using the AKI definition above could be problematic in a study examining prognosis, having some general consensus among physicians around what constitutes an abrupt and significant increase in creatinine can be helpful clinically with regard to differential diagnosis.

2 Likes

By validation of a binary AKI I also mean that one validates that

  • AKI works as a binary variable, i.e., that patients without AKI can be considered homogeneous, and patients with AKI can also be considered homogeneous with regard to organ damage or prognosis
  • AKI means the same thing to different patients, e.g., the baseline SCr does not modify the prognosis impact of AKI
1 Like

As it happens… if baseline renal function (SCr) is poor then outcomes (mortality) for AKI (as defined by SCr) appear worse than if baseline renal function is normal. As I think Frank is suggesting, this highlights another inadequacy in the definition of a binary AKI.

On another point - something I tried for an RCT once where we had multiple SCr measures over time was to consider the area under the creatinine-time curve (I normalised it to baseline SCr and averaged it as a per-hr measure as not everyone had measures over exactly the same time period). While I think better than using a binary outcome, I’ve still some uncertainty in its validity (& I don’t think anyone else took up the suggestion in the years since). The intention was that if we are to use SCr changes as as surrogate for GFR change and for poor outcome then we need some kind of continuous measure that differentiates between both the extent and duration of the loss of renal function as well as accounting for baseline renal function.

1 Like

Better would be to model longitudinal SCr adjusted for a spline function of the baseline SCr. The normalization you did can hide things.

1 Like

It is clear that the probability of detecting a highly abnormal value is greater if the previous value was also abnormal (most patients deteriorate progressively). My question is;

You can’t know if the patient will survive until the next repeat measurement. It seems to me that one needs to account for the number of days at risk with and without AKI (or S-Creatinine on continuous scale)? Allowing subjects to change risk-category based on serial measurements of S-Creatinine will provide an effect estimate of the instantaneous failure rate. As an MD my primary interest is in knowing when I need to intervene (when is the probability of dying greater than the risk of death/complications from the intervention).

Thanks,
Anders

Good questions. There are two settings: (1) measuring effects of therapies and (2) medical decision making for individual patients. You are raising questions for the latter and I was talking a bit more about the former. But they have a bit in common. For decision making, I posit that clinicians should look at all raw measured SCrs that are available up until decision time, and not compute ratios or differences from baseline, and not trust any binary definition of kidney injury. If you wanted to act on a single number, that number should be life expectency or risk of death in a defined time frame. The risk of death would be computed from the entire history of SCr, and you’ll find that the risk equation gives the greatest weight to the last measured SCr and that it doesn’t give as much weight to a baseline SCr as an AKI definition would have you believe.

This recent publication by Girbes/de Grooth is great.

http://jtd.amegroups.com/article/view/33636/pdf

The content is relevant to several datamethods threads (e.g., Phenotyping Clinical Syndromes, CITRIS-ALI, Mathematical Behaviour of the Primary Endpoint), including this one.

The key message is that studies of therapies directed at specific critical illness syndromes (e.g, septic shock, AKI, ARDS) might not have much hope of demonstrating effects on overall mortality “if only a small part of the mortality risk is conferred through syndrome-specific pathways.”

As noted by the authors: “…if we consider in a patient ARDS as the syndrome and colon carcinoma with perforation as the underlying condition: the therapy for ARDS may be outstandingly performed by the best intensivist expert in the world on mechanical ventilation, but if the colon perforation is not well treated the patient will die no matter how well the patient is mechanically ventilated.”

Similarly, does it make sense to study the effects of interventions directed specifically at AKI when AKI can be caused by many diverse disease processes and where it’s the nature of the underlying disease causing the AKI, rather than the AKI itself, that might have a much stronger impact on mortality risk?

1 Like

I totally agree with this problem (responder analysis), and as many others argument, AKI isn’t the only topic in which we face with this problem. I’m just starting studying statisticians and I need to admit that I under aware of a lot of topics.

But, can we used likelihood ratio function, this would calculate the likelihood ratio that the patient has AKI as a function of the Cr value.???

Thanks

Likelihood is confusing in statistics. The likelihood ratio used in diagnostic testing is not the same as the ratio we get as a test statistic from the log-likelihood function. The log-likelihood is the gold-standard method for measuring added information. I go into this in my Regression Modeling Strategies book and a bit here.

1 Like