Appropriate statistical methods to derive a cut-off predictive values for a binary outcome

I am in need of statistical advice. My aim is “To derive waist circumference cut-off values predictive of metabolic syndrome among ART-experienced and naïve patients”.

Metabolic syndrome is defined as having 3 or more of the following characteristics: raised Blood pressure, waist circumference, fasting blood sugar, triglycerides and reduced high-density lipoprotein. Currently, there are no abnormal values of waist circumference specific for black Africa, the one used is based on Europid population which I feel might be different.

If I want to answer that objective, does it mean I need to omit waist circumference in the definition of metabolic syndrome and just leave the four characteristics? or I can still include and find the best predictive values of waist circumference for metabolic syndrome.

Maybe I need to first find the normal and abnormal ranges of waist circumference among our population (note that in Africa we still use the Europid values- no data so far specific for our setting) and see how best they can predict MS as compared to that Europid currently being used.

I will really appreciate your guidance, I am kind of confused about which route to take.

Such cutoffs do not exist and it is futile to seek them IMHO. We never see discontinuous relationships.

Thanks Frank. Then how do I find the normal range of waist circumference in my cohort? Currently we are using the Europid cutoff of >=80cm for female and >=94cm for male. I want to see if I generate one specific for my setting.

Such normal ranges exist only in the mind. If you want to define a reference range and just call it the 0.95 quantile interval, then just compute the 0.025 and 0.975 quantiles. If you need to covariate adjust, use quantile regression. Just don’t assign any other meaning to the interval. Its actual use would depend on the nature of any non-standard group you want to apply it to.

Thanks Frank this is of great help. Let me take that route.

Dear Professor Harrel
I watched with interest the panel on Statistical Controversies on WhyR conference.
The panel remarked that p-value is random variable. I do not understand it or I cannot make sense of the suggestion. Given a Hypothesis, set of values *a dataset", the p-value is deterministic. I can repeat GLM a thousand times with a given dataset and a particular formula and family (binomial etc), I would expect to see the same value. If something is so deterministic why should I consider it as a random variable. It is not like the pick 6 numbers that will be drawn tonight. What am I missing?

I think of the p-value as a constant given your data but a random variable in other respects. I hope someone will respond here and set us straight.

Conditional on a specific dataset and test, the p-value is constant but it is a function of the data and thus, has a sampling distribution. This paper by Duncan Murdoch et al. discusses this at length. See also Andrew Gelmans’ post about this.

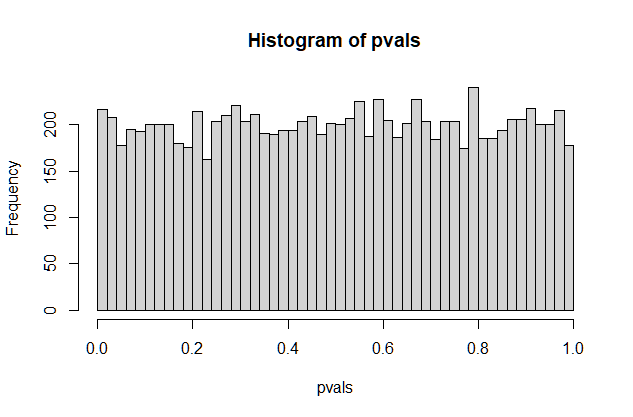
As an illustration: Under a two-sided null hypothesis (and when all other assumptions are met), the p-value of a t-test has a uniform distribution (more on that here):

set.seed(142857)

nsim <- 10000

pvals <- replicate(nsim, {

  x1 <- rnorm(100, 100, 15)
  x2 <- rnorm(100, 100, 10)
  
  t.test(x1, x2, var.equal = FALSE)$p.value
  
})

hist(pvals, breaks = 50)

pvals|506.6x333.6

4 Likes

TY Professor Harrell and COOLSerdash.

My objective or what I am seeking to learn – how to use p-value correctly. If p-value is invalid, then what should I use? I am seeking to get some education here.

I would appreciate if you can help me understand. Here is the typical scenario.

I am doing a little experiment with GLM, my data is fixed … I cannot change it and my formula for this is fixed.

I get a p-value and I use that p-value to reject the NULL or not reject the NULL. By “reject the NULL”
I agree to bear the risk of wrongly rejecting the NULL. That is say p-value is 0.04. I will reject the NULL 4% of the the time, when I should NOT be rejecting the NULL. NULL is indeed valid, but I would reject it. That is the risk I am bearing.
This is how I interpret and use p-value.

Am I doing something naive (or statistically incorrect) interpretting p-value as I did?

That p-value will be different for different dataset/hypothesis combination is a given. I expect that.
So what is the argument against p-value. I do not want to use p-value if there is something
wrong.
So let us assume I ditch p-value altogether – as it appears there is some sort of flaw in its formulation.

For that 1 experiment, is my p-value interpretation incorrect? (I understand due to NFL my
hypothesis will perform very poorly for another dataset) But, for the dataset I am concerned with,
what is p-value telling me? And, for that 1 experiment , the p-value is not a random number.
I am not concerned that p-value may be different, if I change my dataset or the Hypothesis. I expect that.
What is my alternative to evaluate the reliability of my coefficients and my model?
Again without violating the Razor, the alternative should be AS concise AS the p-value.
What do I use in place of p-value ?
I need an objective method to evaluate the reliability.
Thank you for the links to the papers. TY.

Blockquote
I would appreciate if you can help me understand. Philosophically – not statistics or some algebraic expression – I am doing a little experiment with GLM, my data is fixed … I cannot change it and my formula for this is fixed.

A subtle point is that your data are a considered a sample from a hypothetical distribution for statistical purposes. Your data was one subset of a multitude of possible ones. This is a critical point that will be important a bit later.

Blockquote
I get a p-value and I use that p-value to reject the NULL or not reject the NULL.

This is an extremely narrow understanding and interpretation of classical hypothesis tests. Suffice it to say – there are 2 critical perspectives on this. The Neyman-Pearson decision theory viewpoint that compresses (some might say distorts) results into reject/fail to reject categories. Then there is the perspective of R.A. Fisher, where a p-value is a quantitative measure of surprise, conditional on the truth of an asserted probability distribution as reasonably accurate model of the situation.

Blockquote
Am I doing something naive (or statistically incorrect) interpretting p-value as I did?

You are confusing the p-value as a conditional, continuous measure of surprise, with its association to a dichotomous decision rule. The tradition of mapping arbitrary p-value levels (0.5, 0.01, etc.) to reject/fail to reject decisions absent hard thinking about the context is unjustified, but very common.

RE: your sample as fixed. Modern statistical methods treat your “fixed” sample as a population to be sampled from. Instead of making a mathematical assumption about the population that generated your data, you can create new samples using computer programs, repeat the analysis, and calculate the relevant statistics. If your sample was representative of the population, these resamples will also be.

These are known as “resampling” methods, of which there are 2 main ones for estimation: resample with replacement (bootstrap) and resample without (jackknife).

For testing, you can perform permutation tests, which will create an empirical null distribution that you can compare your observed data to, without needing to assume anything about the data generation process, except that the groups are “exchangeable”.

The following is a good paper (no pun intended) that will help you understand p-values; it explores this from the perspective of resampling, so no algebra is needed.

Goodman. W (2010) The Undetectable Difference: An Experimental Look at the “Problem” of
p-values. JSM 2010, Session #119. (link)
3 Likes