Dear Professors and Colleagues,
We have been studying the trends in carbapenem resistance of Pseudomonas aeruginosa over ten years (2013-2022). P. aeruginosa is a significant cause of hospital-acquired infections, particularly in patients with compromised immune systems. We want to confirm whether our statistical procedures and conclusions are correct. Below is a summary of our methodology, results, and conclusions. We used Stata version 18.5 for all analyses. We have some specific questions that need to be addressed.
DATA OVERVIEW
Variables of interest are crp, crp_yr, and year.
fre crp year

crp -- Carbapenems-resistant?
-----------------------------------------------------------
              |      Freq.    Percent      Valid       Cum.
--------------+--------------------------------------------
Valid   0 No  |       1493      59.96      59.96      59.96
        1 Yes |        997      40.04      40.04     100.00
        Total |       2490     100.00     100.00
-----------------------------------------------------------

year -- Year of culture
-----------------------------------------------------------
              |      Freq.    Percent      Valid       Cum.
--------------+--------------------------------------------
Valid   2013  |        444      17.83      17.83      17.83
        2014  |        317      12.73      12.73      30.56
        2015  |        255      10.24      10.24      40.80
        2016  |        275      11.04      11.04      51.85
        2017  |        225       9.04       9.04      60.88
        2018  |        200       8.03       8.03      68.92
        2019  |        251      10.08      10.08      79.00
        2020  |        140       5.62       5.62      84.62
        2021  |        192       7.71       7.71      92.33
        2022  |        191       7.67       7.67     100.00
        Total |       2490     100.00     100.00
-----------------------------------------------------------

. table year, statistic(frequency) statistic(mean crp_yr)

---------------------------------------
                |  Frequency   Percent
----------------+----------------------
Year of culture |
  2013          |  444         28.82883
  2014          |  317         34.70031
  2015          |  255         40.39216
  2016          |  275         45.81818
  2017          |  225         43.11111
  2018          |  200         43.5
  2019          |  251         33.06773
  2020          |  140         40
  2021          |  192         50
  2022          |  191         58.11518
  Total         |  2,490       40.04016
---------------------------------------
HYPOTHESIS AND OBJECTIVES
-
Hypothesis: The resistance rate of P. aeruginosa against carbapenems has been increasing over the past ten years.
-
Objective: To assess the resistance trend over the years, determine if it is increasing or decreasing, conduct statistical analysis to confirm the trend, and quantify it if possible.
RESULTS
- Kendall’s Rank Correlation
. ktau year crp_yr

  Number of obs = 2490
Kendall's tau-a = 0.5221
Kendall's tau-b = 0.5867
Kendall's score = 1617933
    SE of score = 40867.128   (corrected for ties)

Test of H0: year and crp_yr are independent
     Prob > |z| = 0.0000  (continuity corrected)
Interpretation: There is a significant positive correlation between year and carbapenem-resistant percentage.
- Cochran-Armitage Test for Trend
. nptrend crp, group(year) carmitage exact

Cochran–Armitage test for trend

   Number of observations =    2,490
         Number of groups =       10
Number of response levels =        2

--------------------------------------------------------
             |                        Mean
             |                    response        Number
       Group |   Group score         score        of obs
-------------+------------------------------------------
        year |
       2013  |          2013      .2882883           444
       2014  |          2014      .3470032           317
       2015  |          2015      .4039216           255
       2016  |          2016      .4581818           275
       2017  |          2017      .4311111           225
       2018  |          2018          .435           200
       2019  |          2019      .3306773           251
       2020  |          2020            .4           140
       2021  |          2021            .5           192
       2022  |          2022      .5811518           191
--------------------------------------------------------

                Statistic = 0.0211869
                Std. err. = 0.0033507
                        z = 6.323
               Prob > |z| = 0.0000
               Exact prob = 0.0000 (10,000 Monte Carlo permutations)

Test of departure from trend:
                  chi2(8) = 31.75
              Prob > chi2 = 0.0001
Interpretation: There is a significant increasing trend in carbapenem resistance, which is not linear.
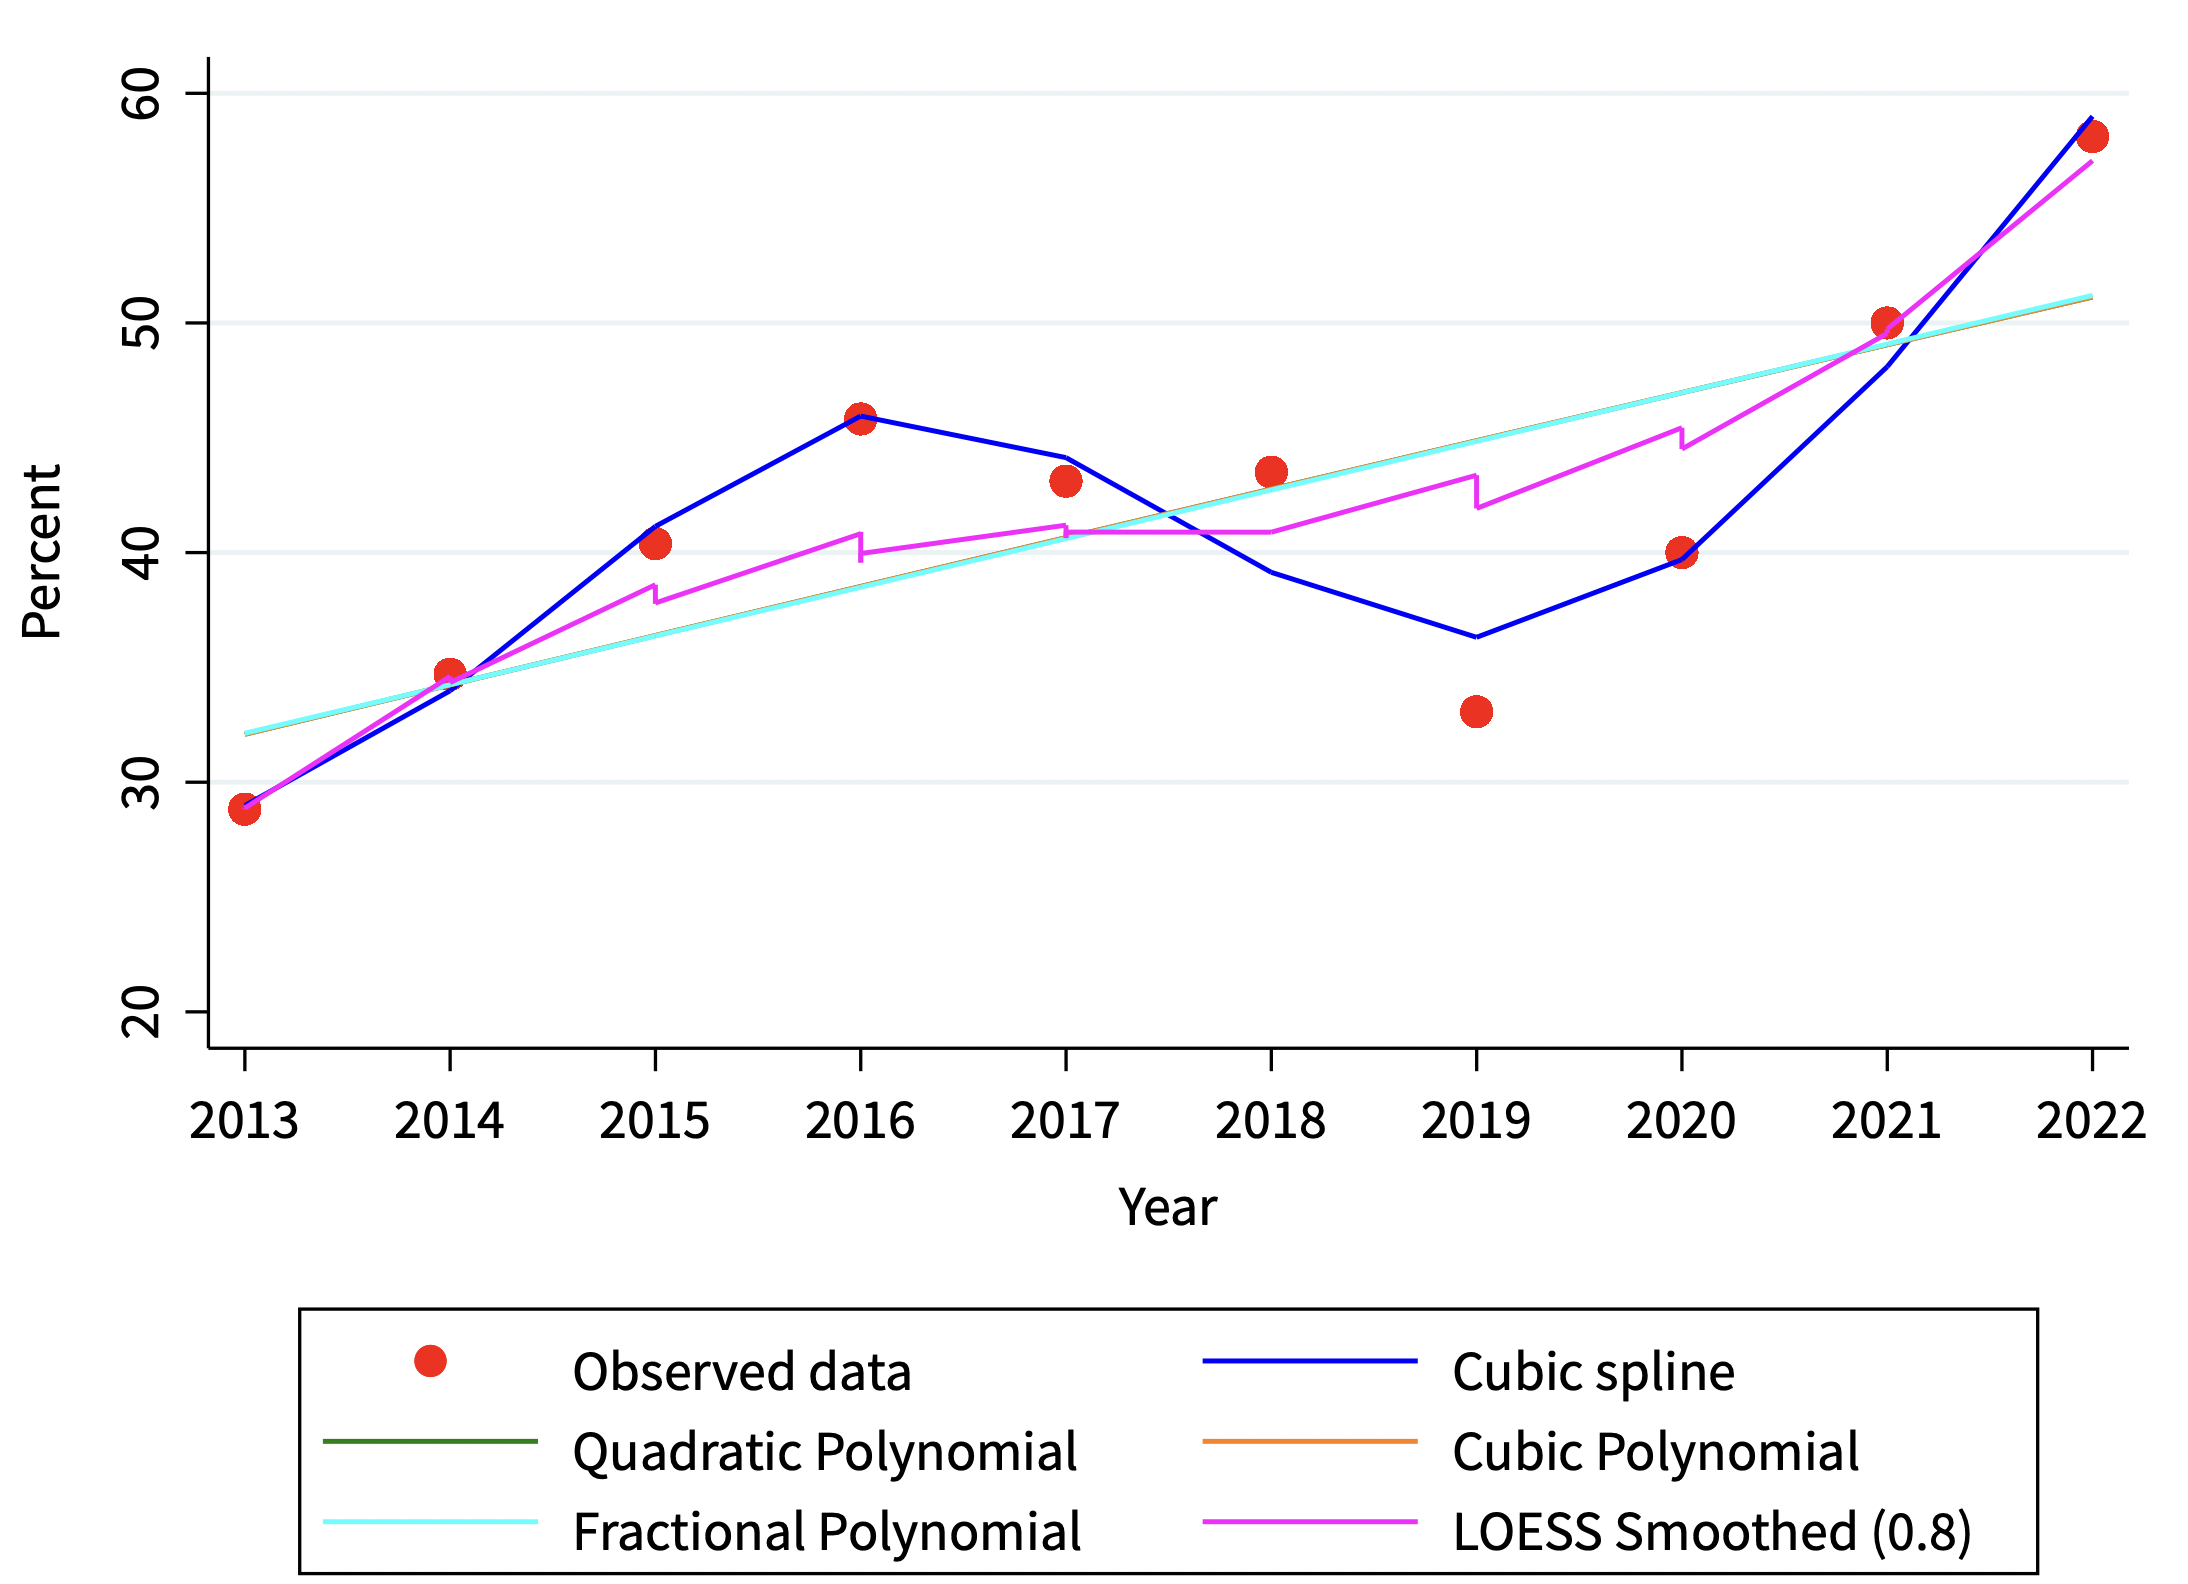
- Nonlinear Spline Model
Given that the relationship between resistance and time is not linear, we fit a cubic spline-restricted linear regression model.
mkspline spl_year = year, cubic

regress crp_yr spl_year1 spl_year2 spl_year3 spl_year4

      Source |       SS           df       MS      Number of obs   =     2,490
-------------+----------------------------------   F(4, 2485)      =  12987.82
       Model |  164363.211         4  41090.8028   Prob > F        =    0.0000
    Residual |  7862.02978     2,485  3.16379468   R-squared       =    0.9544
-------------+----------------------------------   Adj R-squared   =    0.9543
       Total |  172225.241     2,489  69.1945525   Root MSE        =    1.7787

------------------------------------------------------------------------------
      crp_yr | Coefficient  Std. err.      t    P>|t|     [95% conf. interval]
-------------+----------------------------------------------------------------
   spl_year1 |   4.364291   .1364428    31.99   0.0000     4.096737    4.631844
   spl_year2 |   51.64248   2.319006    22.27   0.0000      47.0951    56.18986
   spl_year3 |  -135.0883   4.033898   -33.49   0.0000    -142.9985   -127.1782
   spl_year4 |   155.7053   2.331507    66.78   0.0000     151.1334    160.2772
       _cons |  -8756.335    274.713   -31.87   0.0000    -9295.025   -8217.645
------------------------------------------------------------------------------

Model Comparison:
The table below presents the R-squared, AIC, and BIC values for the different models compared:

 Model                 | R-squared | AIC      | BIC      |
|----------------------|-----------|----------|----------|
| Cubic Spline         | 0.9465    | 10342.4  | 10371.5  |
| Cubic Polynomial     | 0.8712    | 12527.16 | 12527.16 |
| Fractional Polynomial| 0.6763    | 14820.53 | 14837.99 |
| Quadratic Polynomial | 0.5538    | 15619.66 | 15637.12 |
Interpretation: The cubic spline model showed significant coefficients for each term, indicating a good fit with an R-squared value of 0.9544. It also confirmed the nonlinear trend over the years.
CONCLUSION AND QUESTIONS
The resistance rate of P. aeruginosa against carbapenems has significantly increased over the past ten years. The cubic spline model was the best model for capturing this nonlinear trend.
AI Models’ Recommendations:
We consulted multiple AI models (GPT-4, Llama 3.1, Perplexity Pro, Claude Sonnet 3.5, and Gemini 1.5 Pro), and most of them recommend the following:
-
Generalized Additive Models (GAMs):
Consider using GAMs for a flexible alternative to spline models, allowing for automatic selection of the degree of smoothing. -
Predicted Rates:
Calculate predicted resistance rates at key points (e.g., start, middle, and end of the study period) to quantify the change over time.
Questions
We are concerned about:
- The appropriateness of using Kendall’s tau and the Cochran-Armitage test for trend.
- The interpretation of the cubic spline model and its coefficients.
- Do you agree with the AI models’ suggestions, and should we consider implementing them, specifically the GAM model?
- How can the resistance rate be accurately quantified over the years? For instance, can we say the resistance rate is increasing by approximately xx.xx% per year based on the cubic spline model or any other suggested model?
Final Note:
We came across a post by @f2harrell, which was very informative and made us unsure about using AI models to run our analysis.
We appreciate any help you can provide.
Abdullah