Baseline adjustment vs Fixed Effects for Observational Longitudinal Data

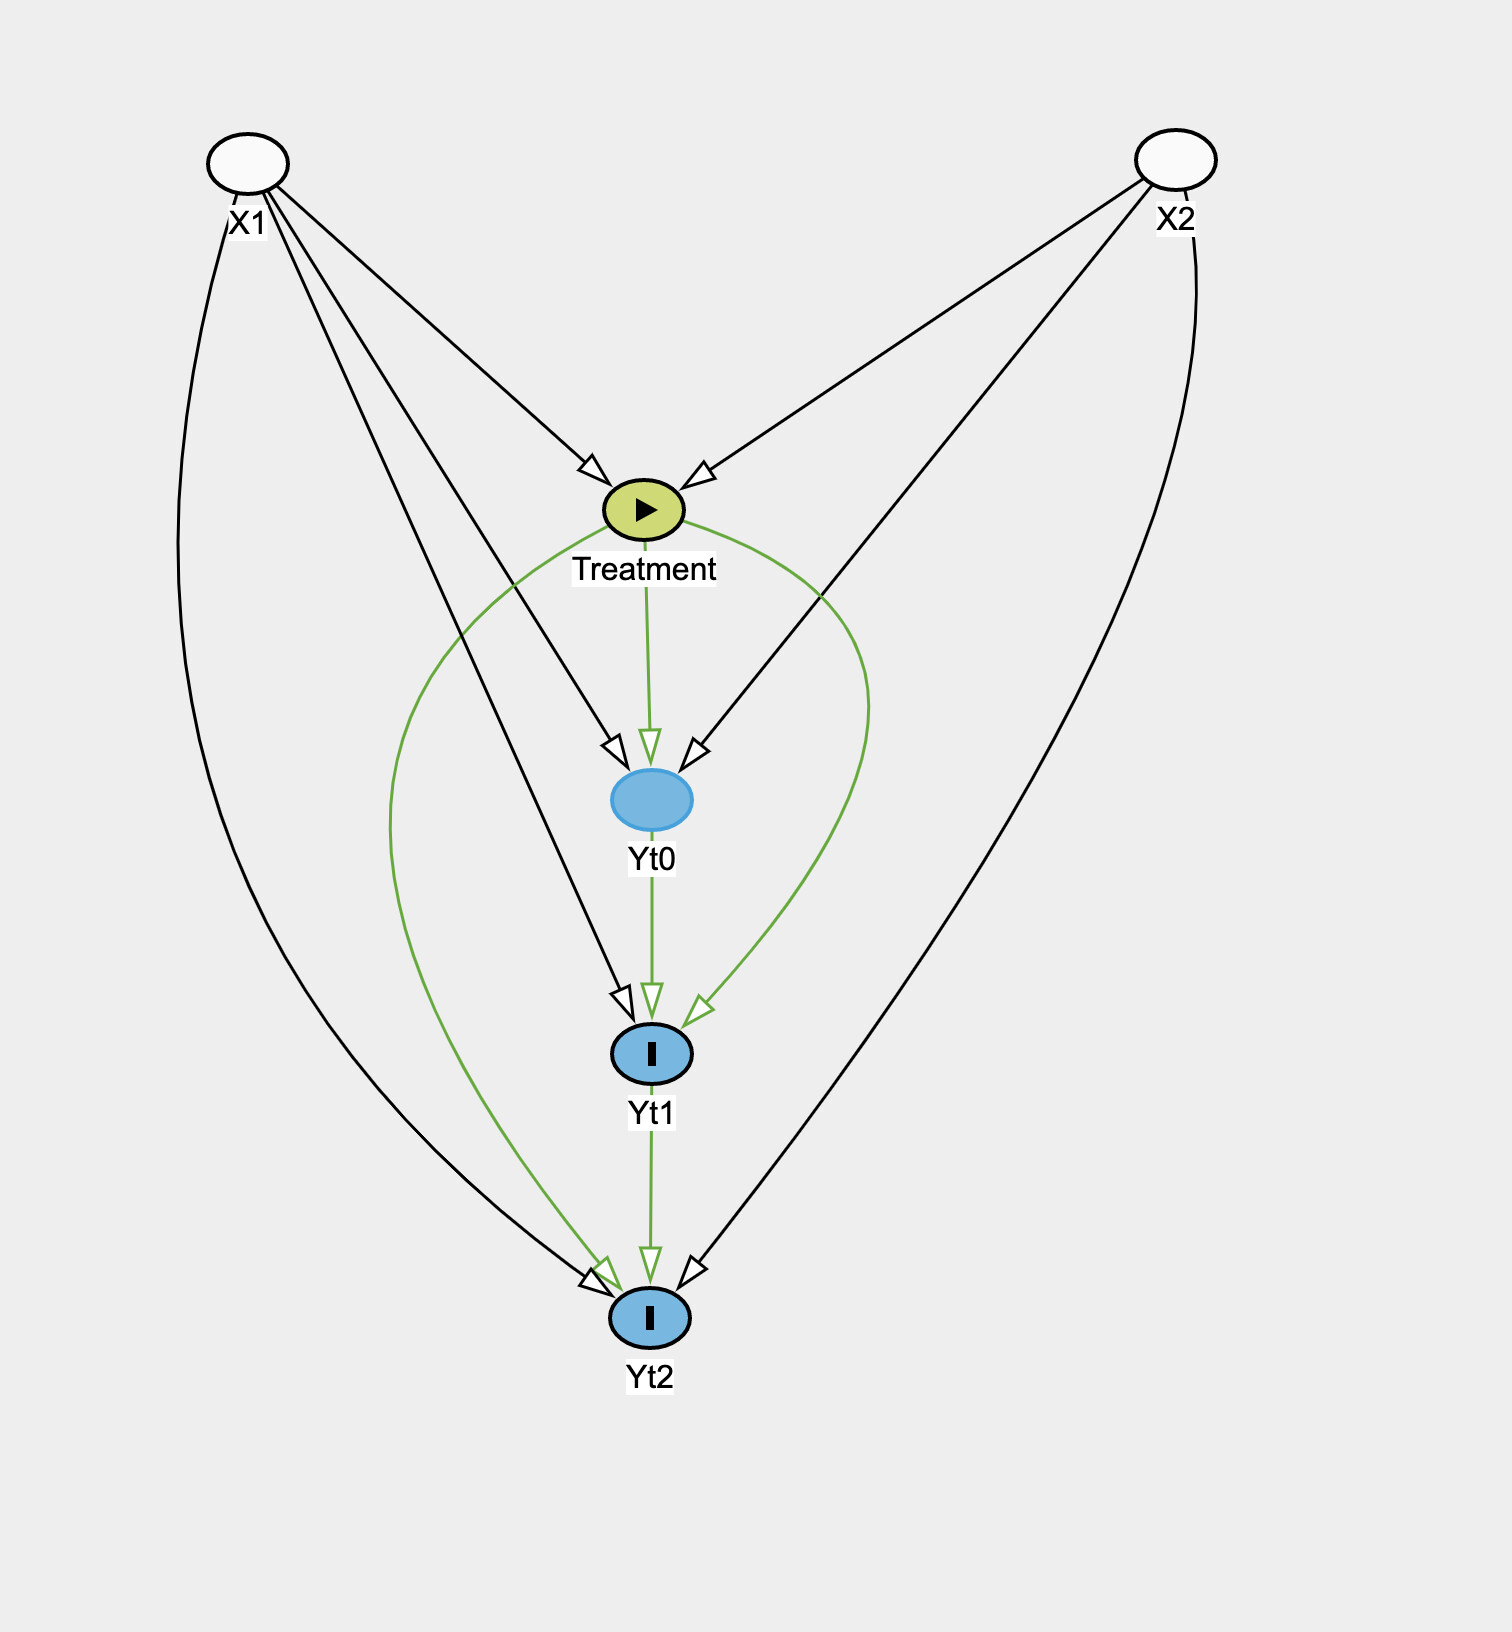
So take a situation in observational data where you have time-fixed treatment T, time-fixed covariates X_i, outcome Y_it. Treatment is not randomized and directly depends on covariates, which also influence the outcome. The following is the causal graph:

Essentially the covariates and treatment affects each of the outcomes which are also influenced by previous outcome. How would you estimate the causal effect of the treatment?

I’m new to graphs and in Biostat learned things like Mixed Models, ANCOVA, etc but the newer causal inference graphical model SEM stuff seems to be suggesting these approaches are not really valid (or I haven’t made the connection from DAG to these).

I would like to find the causal effect of the treatment on the outcome at each time point. The daggity software is telling me that when looking at the effect of Treatment on Yt1 that adjusting for Baseline is adjusting for a mediator and not good for estimating the total effect of Treatment on Yt1, but that this adjustment is needed to estimate the “direct” effect.

In school, we also learned that you could just do a mixed model and treat (Yt0,Yt1,Yt2) as the outcome, do a random intercept for Subject ID and then Treatment, X as covariates. Then I found out about Fixed Effects and how it is better to include Subject ID as a fixed effect so as to account for unobserved time fixed confounders: Fixed effects model - Wikipedia

However the fixed/mixed effects approach (with all Ys as the outcome) still wouldn’t consider the possible effect of the previous outcome on the current right? That is what this paper seems to suggest with assumption (b): https://imai.fas.harvard.edu/research/files/FEmatch.pdf.

Whereas doing a model for Yt1 against Yt0, X, Treatment would? And then another model for Yt2 vs Yt1, X, Treatment? That seems to be what the graph suggests would give the direct effect of the Treatment on the outcome at each time point.

I am just really confused with these newer causal graph techniques and how they relate to what I already learned, because prior to learning about them I probably would have just thrown this sort of data into a mixed model and looked at the Treatment coefficient. But now I am realizing that may not be correct…

Attached is the causal graph. What model would be reasonable for estimating the treatment effect with this graph?

1 Like

In my experience the use of ordinary causal diagrams does not invalidate and is largely orthogonal to modeling decisions such as whether to use fixed or random slopes. However, I do agree that your scenario may be better addressed by G methods. Here is a very accessible description of these considerations that includes causal diagrams.

Thanks, can you expand on the causal graphs being orthogonal to the modeling decisions? In a lot of the recent biostat as well as even bayesian, ML/AI causal literature, it seems like the graphs essentially are the model in that they directly inform the structure of the model which you use. For example the probabilistic graphical models for discrete data: Causal Inference — pgmpy 0.1.15 documentation

Its interesting though, causal inference in some sense is opposite of predictive ML but it does feel at times that all these graphs make it equally if not more black box to understand how to actually estimate the effects of interest. I wonder though, if people actually trust “black box causal inference estimates” that come out of these DAGs. There are tons of packages nowadays that do this, but I am trying to figure out at least how to replicate simple common situations to build my intuition so that I can explain these methods even if I don’t fully understand the computation.

I’m thinking for the graph above, since in this particular case the Treatment is fixed but only the outcome is varying, I could use IPTW to estimate weights of Treatment at Baseline, and then just do 2 models at t=1 and t=2 where I adjust for the previous outcome in a weighted GLM and then the coefficient of the treatment in each model would be the direct effect of the treatment on the outcome at that time? Basically:

P(Tmt) = f(X_1,X_2)
Y_{t1} = b_{01} + b_{11}Y_{t0} + b_{21}Tmt , weight by 1/P(Tmt received)
Y_{t2} = b_{02} + b_{12}Y_{t1} + b_{22}Tmt , weight by 1/P(Tmt received)

Then b21 would be the direct effect of the treatment on Yt1 and b22 would be the direct effect on Yt2?
Getting the proper uncertainty estimates seems difficult though due to the first step.

1 Like

Think of it this way: the DAGs encode one aspect of the model (i.e., the non-parametric structural causal constraints) but they are less committal about other aspects. For example, let’s take the DAG X->M->Y where X is the treatment, M is the mediator, and Y is the outcome. The statistical model can be a proportional odds regression (treating Y as an ordinal outcome), a logistic regression (dichotomizing Y), a linear regression etc etc. all based on the same DAG.

Or take the practical DAG example we provide in Figure 3B here. There are multiple different ways, all consistent with the same DAG, that we could have used to model the relationship between renal cell carcinoma histology and overall survival. DAGs are useful tools but are only one part of modeling considerations.

I agree, IPTW does tend to be the most accessible of the G methods and the approach you proposed is plausible within that framework. However, looking again more carefully at your DAG, I do not really see it being incompatible with a mixed model as you originally described in your first post. G methods would be preferable if there were time-dependent exposures or confounders, which I do not see in the DAG.

1 Like

Think of it this way: the DAGs encode one aspect of the model (i.e., the non-parametric structural causal constraints) but they are less committal about other aspects. For example, let’s take the DAG X->M->Y where X is the treatment, M is the mediator, and Y is the outcome. The statistical model can be a proportional odds regression (treating Y as an ordinal outcome), a logistic regression (dichotomizing Y), a linear regression etc etc. all based on the same DAG.

Yea, though in this case you mention the models are still in the same general functional form of Y = f(X,M) whereas in this example, the mixed model would be a different functional form than having separate models at each time point adjusted for the previous.

I agree, IPTW does tend to be the most accessible of the G methods and the approach you proposed is plausible within that framework. However, looking again more carefully at your DAG, I do not really see it being incompatible with a mixed model as you originally described in your first post. G methods would be preferable if there were time-dependent exposures or confounders, which I do not see in the DAG.

In the above example I don’t but actually I also deal with time-dependent exposures in the next part because the Ys I drew above actually become Ms (mediators) which then connect to other outcomes Ys at each time point. Didn’t draw the full graph earlier since I wanted to understand a simpler case. In that case, I want the effect of each M and then I will have time-dependent exposures like below. In this case, would some joint modeling approach be needed?

1 Like

Ouch, that’s a lot. A useful philosophy when modeling typical clinical data is to keep things as simple as plausibly possible, at the cost of increasing bias in the bias vs variance tradeoff. I would still go with one full mixed model. Others may incorporate a shared frailty approach (for multiple observations coming from the same person) or correct for intra-patient correlation using the robcov function in RMS. If it fit the clinical question and context to model Mt0-2 as a dynamic treatment regime, I would then consult with my colleagues to see if we could model it using the approaches described here, here, and here. Others in the forum may have additional thoughts.

2 Likes

Thought I’d give an update. I ended up doing a mixed model as a 1st approach, and then also trying out fixed effects, GEE, and a fancy bayesian network approach. All of them pretty much had roughly around the same effect sizes within an SE of each other. But still by far it was the most fun to do a fully generative probabilistic programing solution and I learned a lot from it, and seeing that it’s about the same gave me confidence that it was done properly.

It may be because at least even if my exposure is time varying, at least my covariates aren’t but at least for the “strong signals” they showed up in both methods with effects near the same order of magnitude. The differences happened for questionable/weak signals. Indeed the mixed model for the strong signals also had a slightly lower variance than the others.

Makes me think, I feel that “causal inference” in terms of the methods is similar to the previous hypes in stat/ML. You used to be cool if you ran a random forest, and now its like everyone is hyping causality.

We need some sort of middle ground on when exactly to use the more fancy approaches vs. just doing a simple “associational” analysis and having the domain experts use orthogonal sources to conclude strong evidence even if in a stat sense the effect wasn’t “causal”.

At the end of the day, it seems if the data quality is good, then standard methods vs causal methods will probably lead to the same conclusion bar some very insidious case of simpsons paradox, at least on tabular data.

I think causal inf has more impact probably on complex nonlinear unstructured data and AI systems. Places where the decision making needs to be “automated” and then it would be good to encode some causal reasoning into the agent. Stuff where the entire system is a black box and its not so easy as this situation here to “probe it”. In biomedicine, people usually are going to validate findings orthogonally/scientifically/via RCTs.

1 Like

Thanks for the update. Glad to know you are happy with your model. I would be careful with sweeping generalizations. What causal diagrams do is help us represent how we think our data were generated. This can be helpful for many data analyses applications both simple and complex, biomedical or other.

A simple illustrative example is our institutional kidney cancer data we analyze in figure 3 here. When we incorporated the plausible causal relationships in our simple regression models, they were able to reproduce the expected finding that kidney cancer subtype impacts overall survival.

Another tangible example is this datamethods thread which led to this publication.

Causal diagrams can also help showcase open problems in biostatistical methodology as discussed in this datamethods thread motivated by this commentary on adjuvant therapy considerations in oncolology.

1 Like

More so than causal diagram (which was still helpful) I was referring to the computation/estimation methods. In the Bayesian Network probabilistic approach, one is sort of directly using the DAG in the computation. Each node is modeled as a function of the parent nodes.

And then in the end, if you use Stan, to represent the “do” operator (using Pearl’s terminology) you “hard set” some of the nodes in the sampling statements within the generated quantities block. And you can do conditionals with if statements. Hence it can get kind of complicated quickly. While the code was repetitive (especially since im a complete beginner at Stan), it was ~250 lines and tons of debugging. Many places to go wrong too. I think it would be difficult to use this in a regulated situation.

But still very cool, especially since I like computational/ML stuff.

1 Like