Challenges in determining meaningful between group differences of surgery vs non-surgical treatment

Dear all,

I contacted @f2harrell by email regarding a protocol for a survey I am planning as part of my PhD (my background is physiotherapy). Frank suggested moving the discussion to the forum. This post is detailed because I think the method is not widely known. Thank you for bearing with me.


Background

An issue that interests me is how we determine whether between group differences observed in RCTs are meaningful from a patient perspective.

Most often, the minimally important difference (MID) concept is used 1, 2. However, methods typically used to derive MIDs have been criticised (this paper describes the issues well).

Currently, the dominant method involves anchor-based approaches 3.

  • E.g, one determines the mean change from baseline in a PROM (e.g., a pain scale) among patients who rate themselves as “somewhat better” on an external anchor (e.g., a global rating of change scale, GROC).
  • In this case, the MID is actually derived from within-group changes and represents a minimally important change (MIC) 4.
  • Despite this, these estimates are widely used to interpret between-group differences in RCTs, meta-analyses and guidelines 5, 6.
  • This is conceptually flawed 7

In addition, distribution-based methods (e.g., defining the MID as 0.2 SD) or other arbitrary thresholds are sometimes used – but these approaches a) arbitrary and b) completely ignore the patient perspective.

Finally, none of these methods explicitly account for the risks, costs, or inconveniences associated with interventions. Often the same MID is applied to interpret between group differences of very different comparisons. But logically the MID for an comparison where one intervention carries risk of significant harms (e.g., surgery vs non-surgical treatment) should be higher than that of a comparison without such harms (e.g., education vs no treatment).


The smallest worthwhile effect

To overcome these issues, Barrett et al. introduced the smallest worthwhile effect (SWE) 8:

“The smallest beneficial effect of an intervention that justifies its costs, harms, and inconveniences.”

Key features of the SWE according to Ferreira 2018:

  • Must involve healthcare consumers.
  • Must be intervention-specific, considering the treatment’s harms, costs, and inconveniences of two options.
  • Must be defined in terms of the contrast between intervention and control, not just change over time.

The benefit-harm trade-off (BHTO) method can be used to elicit the SWE:

  • Risk, costs and other inconveniences of two treatment options are explained.
  • Expected outcome with control option is presented (e.g., non-surgical treatment).
  • Patients are asked what additional benefit they would need from the intervention option (e.g., surgery) to consider it worthwhile.

An example: SWE for NSAIDs vs no treatment

After presenting the relevant information about both options Hansford et al used the following script. Other studies have used a similar structure.

“If you didn’t take the drugs your back pain could get about 20% better in the next week as this is the natural course of low back pain.
However, if you were given the anti-inflammatory drugs, how much additional reduction of your pain would you need to see to make the drugs worthwhile?
”

Participants entered an additional improvement between 0 and 80% (e.g., 40%). This value was then reduced:

“Now, suppose you only got 30% better on top of the initial 20% improvement (ie, a 50% total reduction). Would that be enough of a reduction in pain to make the drugs worth their cost and side-effects?”
(Iteratively decreasing the benefit until the patient says “No.”)

The smallest additional improvement the patient accepts is their SWE. This is repeated for each patient. At the group level the SWE is usually reported as the median.

In this case the median SWE was 30% (IQR 10–50%). This is interpreted as 50% of participants would consider taking NSAIDs worthwhile if it improved their back pain by an additional 30% compared to no treatment. One could also use the 80th percentile (effect considered large enough to be worthwhile by 80% of participants) 9.

Below you see bar graphs of SWE values from that study and another one by Hansford. In all scenarios a 20% improvement with control was presented.

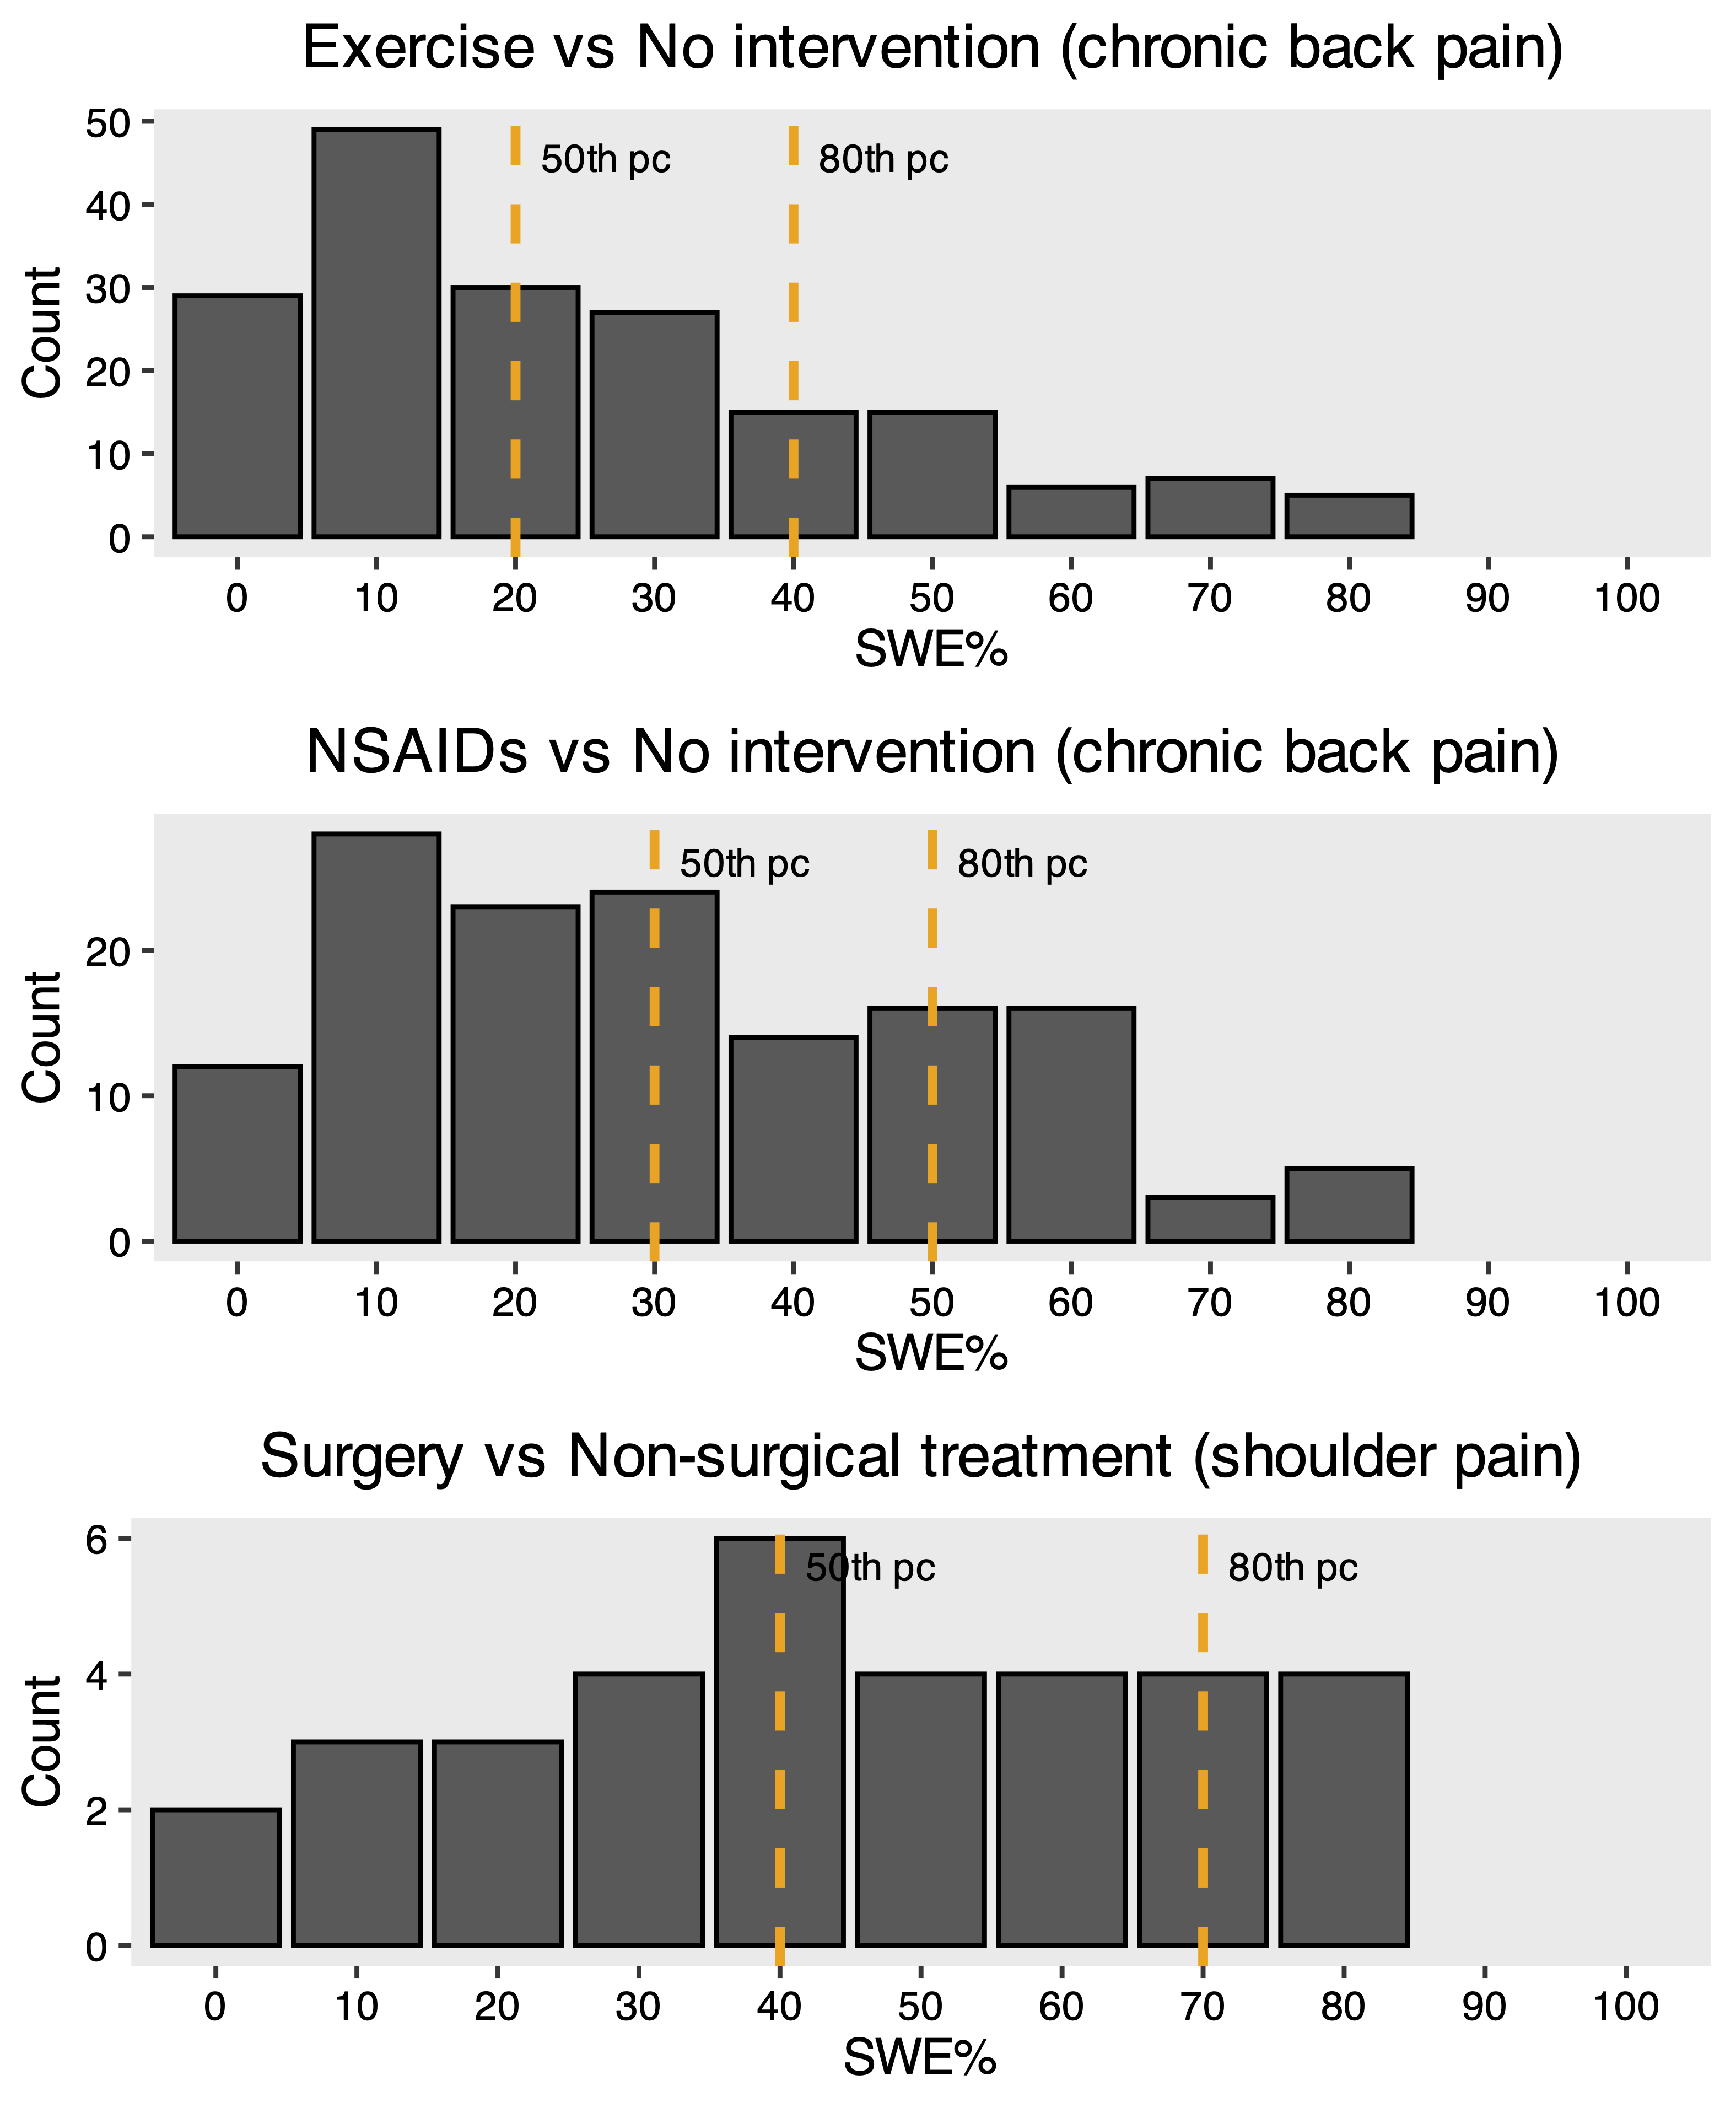
Summary: The SWE was higher for riskier interventions (e.g., surgery vs exercise) underlining the point made in the background section.


How the SWE is applied to trial data

So far, researchers assumed the SWE is transportable because it is derived from %improvement of baseline:

  • To apply it to trial or meta-analytic result you multiply the trial or pooled baseline score by the SWE %.
  • You then compare the between-group difference to this threshold.

Example:

  • Baseline back pain in a RCT = 6/10.
  • SWE = 30%.
  • 6 Ă— 30% = 1.8 points.

Thus, a between-group difference ≥ 1.8 points would meet the SWE threshold for 50% of patients.

Is this valid?


My project

As part of my PhD I am looking at people with sciatica caused by a lumbar disc herniation with an indication for elective surgery. I aim to use the BHTO method described above to estimate the SWE for surgery vs non-surgical treatment on:

  • Leg pain
  • Back pain
  • Disability
  • Time to recovery

Specific questions and challenges

Framing of the survey (most important for me right now)

  1. How should I frame the BHTO scenario to ensure it is a) aligned with how patients think/ easy to understand and b) scientifically valid?

Initially, I framed SWE questions using % additional improvement, as in previous SWE studies (see an excerpt below).

Framing using %improvement:

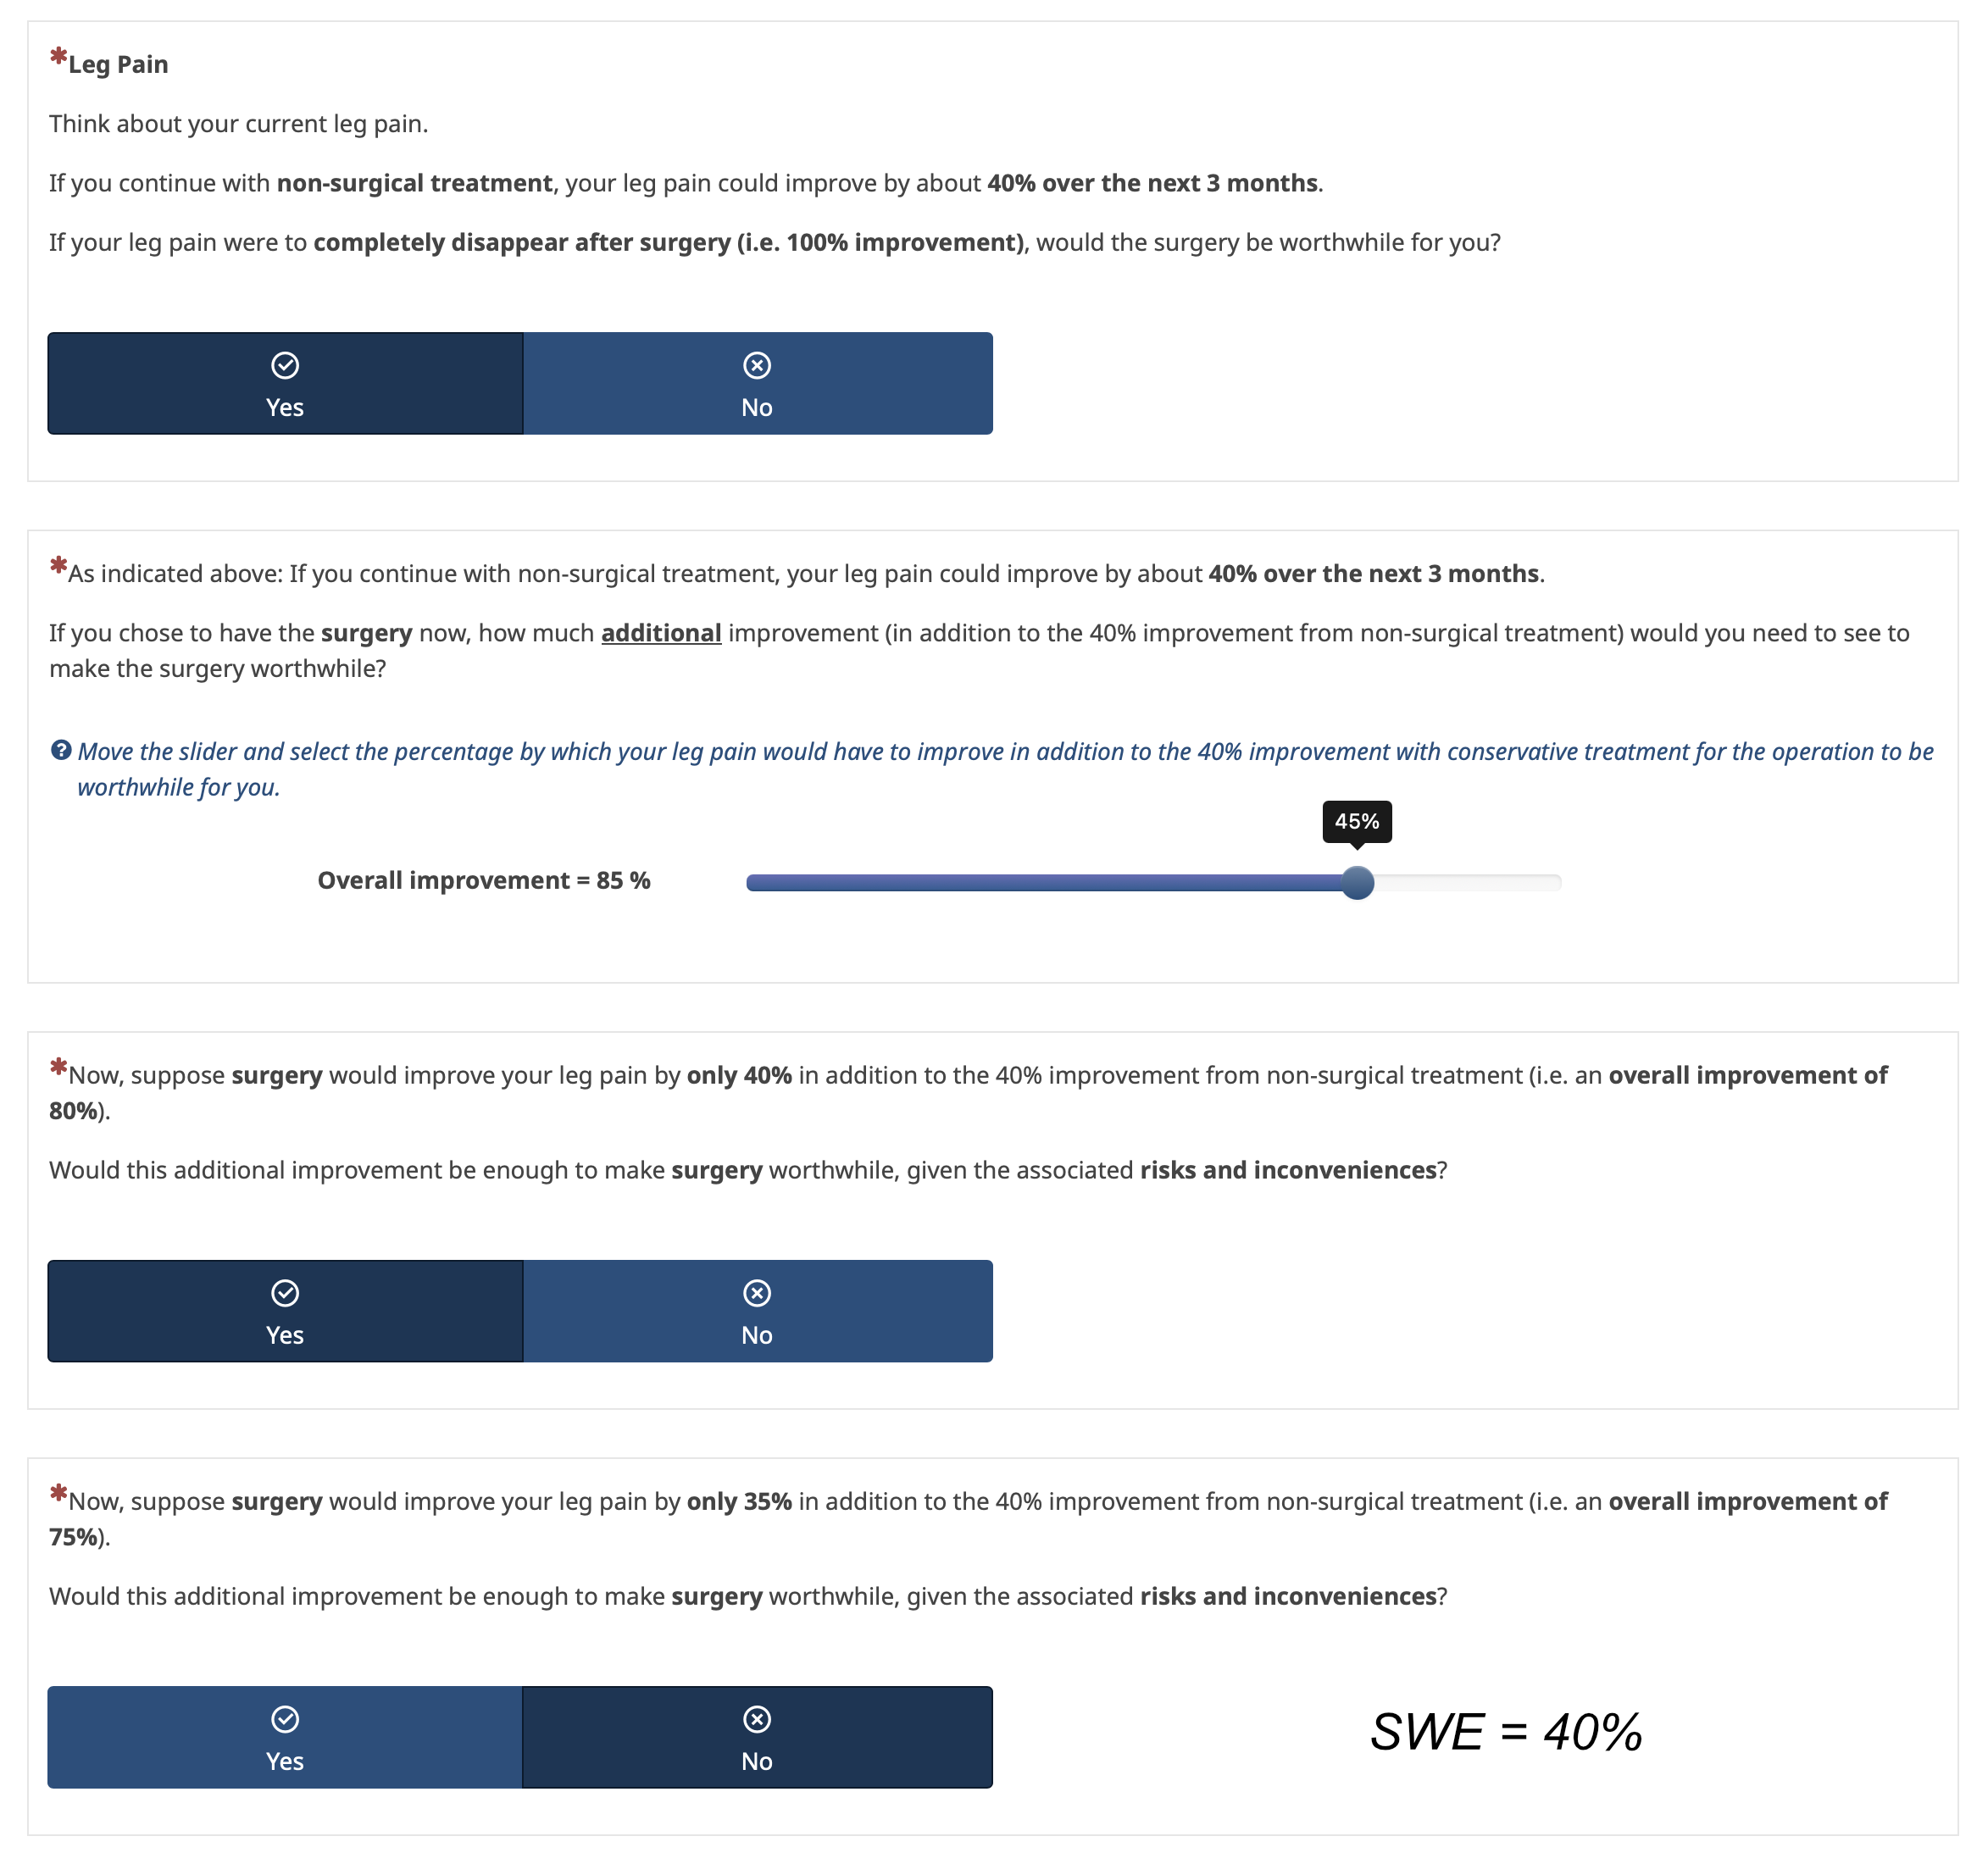
However, Frank noted in his email and here that “patients care most about their current status and little about how they got there.”

Thus, I am now exploring framing using the absolute score at 3 months.

Framing using fixed final score:

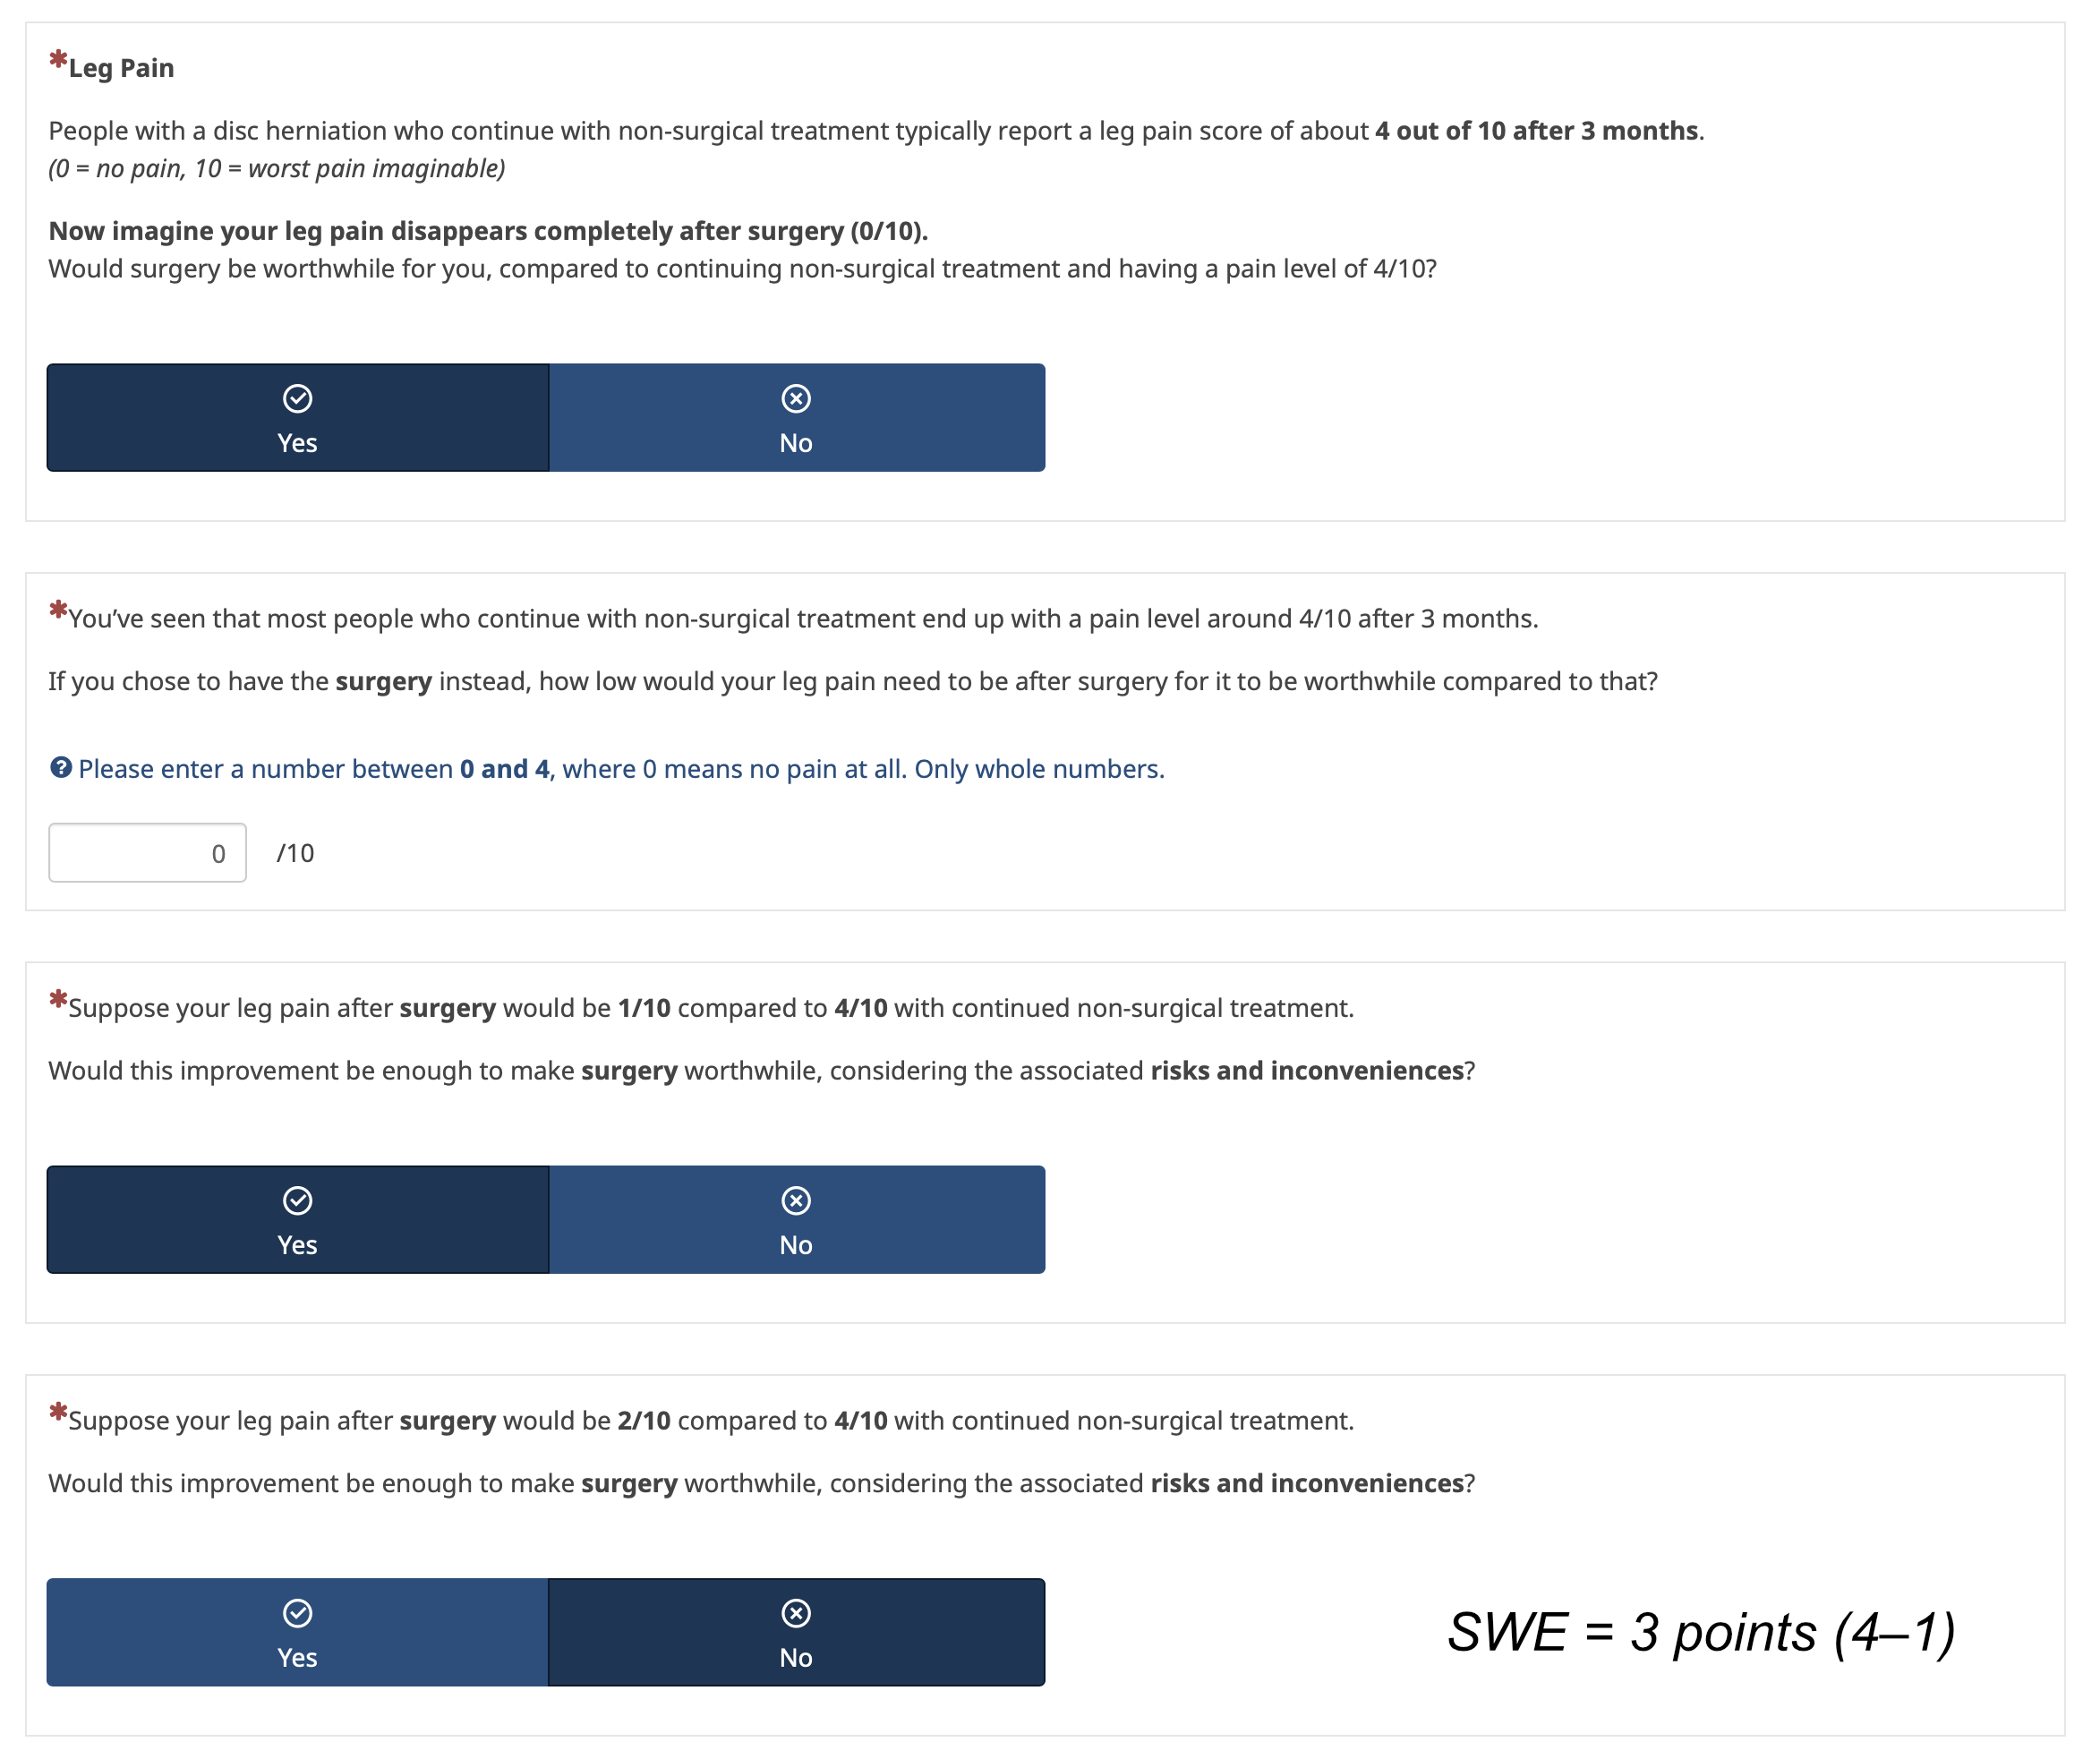
There are however various options on how to arrive at the final score. To inform the expected improvement with non-surgical treatment I pooled data from conservative arms of RCTs and cohorts of people with an indication for elective surgery. I can pool a) the follow-up scores, b) the change from baseline or c) the proportional improvement (see Table below).

Outcome Final score Change from baseline %Change
Leg pain (0-10) 3.6 -2.6 0.42
Back pain (0-10) 2.8 -1.7 0.35
Disability (0-100 ODI) 30.6 -15.1 0.33

I collect the patients current pain and disability which means I could “personalise” the expected outcome for each patient. But I am not sure if that is valid.

Data Calculation Assumption about improvement Example baseline leg pain (0–10) Non-surgical outcome in survey
Fixed score Pooled value at 3 months ? 8
6
3.6
3.6
Change score Baseline – pooled mean change Additive change 8
6
5.4
3.4
% Change Baseline – (Baseline × 42%) Proportional change 8
6
4.6
3.5

Which option should I choose? An issue with using the fixed final score could be if a participants baseline pain is already below that. I could set a certain pain threshold as an inclusion criterion.

For the other options I am not sure what is more valid an additive or a proportional change?
Also, if each participant’s expected non-surgical outcome is personalized, would this pose an issue for interpreting the final SWE estimates - since each participant would be making their trade-off relative to a different value? Could I/ should I adjust for the expected improvement with non-surgical treatment in a regression model?**

  1. Any advice on how to frame disability outcomes using absolute scores?

While I think patients can conceptualise a target like “4/10 leg pain”, this becomes much harder for something like “30/100 disability” on the Oswestry Disability Index (ODI).

This issue seems less pronounced when using percent improvement (although it is still difficult IMO) as in a previous study on SWE for NSAIDs. But there we have the issue of not having the final scores again.

“Now think about the daily activities that you can’t do as a result of your back pain. If you didn’t take the pills your ability to perform your daily activities could get about 20% better in the next week. However, if you were given the anti-inflammatory pills, how much additional reduction of your disability would you expect to see?” Ferreira 2013

  1. Median time to recovery or restricted mean survival time (RMST)?

For the outcome time to recovery I have estimates for both median time to recovery (12 weeks) and RMST (20 weeks) for the non-surgical treatment strategy. I want to know how much faster people would need to recover to consider surgery worthwhile. I thought to use RMST because I have never seen the difference in median survival times reported with a confidence interval. Any arguments for using one over the other?


Analysis

  1. Can I transform the absolute SWE to a proportional SWE to make it transportable across baseline score and scales?

The handy thing with using %SWE is that it can be applied to trials with different baseline pain for example (see above). Or if I have the %SWE for disability I could apply it to different scales that measure disability. When I use the final state framing I would get absolute SWE estimates, e.g. lets say the results of my survey would be that patients require an additional 3 point change in leg pain on a 0-10 scale to consider surgery worthwhile over non-surgical treatment. Could I transform that to an %SWE by dividing the individual absolute SWE values by the respective patients baseline and then take the median of that?

  1. Any advice on sample size calculation to get a precise median estimate of the SWE? I used presize which works for means. Is there such a procedure for medians?

  2. I want to explore whether patient characteristics influence the magnitude of SWE. Should I use ordinal regression? (see bar plots above for typical data structure)

  3. If so how should I calculate sample size for ordinal regression with ~11 candidate predictors (12 DF, even more with splines)?


Other

  1. Do you see any other major methodological or framing problems?

Thanks for reading this long post!
I would greatly appreciate any advice, suggestions, or critiques.

@vigotsky I really liked this paper of yours. I thought this could be relevant about the underlying assumptions of improvement with non-surgical care. Would love to hear your thoughts too.
@VickersBiostats I think the method could overcome what you critiqued here and get us better comparison specific MCIDs. What do you think?

Best,
Florian

4 Likes

Rob Balshaw provided this suggestion on X:

Jeff Sloan at Mayo did some work on this with a number of colleagues. See, e.g.,

Revicki D, Hays RD, Cella D, Sloan J. Recommended methods for determining responsiveness and minimally important differences for patient-reported outcomes. J Clin Epidemiol.

1 Like

Speaking from a perspective in which I imagine myself as the patient, I would be utterly turned off by counseling (or a survey) that cast outcomes in such abstract — and therefore meaningless — terms as “your pain would improve by 30%”. I want to hear about the objective improvements in my functioning, such as ability to resume long walks with my dog.

Also, any talk of “percent improvement in pain” seems to ignore basic facts about pain thresholds as the determining factor. Maybe a 30% improvement in my pain [on whatever scale you choose] brings it down below the threshold where it impacts my functioning at all, and enables a 100% return to normal activity.

5 Likes

With David’s comments in mind, I’d like to see someone develop an instrument along the lines of the Duke specific activity index that names a list of activities in some kind of difficulty ordering (Duke was based on oxygen consumption required) with pre-treatment on the x-axis and post-treatment on the y-axis. The patient would find where they are at baseline and then identify an acceptable goal post-treatment. If our data in lower back pain rehab are relevant you’d see lots of patients setting baseline-independent goals.

2 Likes

Hi Florian

General observations from a family physician:

  • Lumbar radiculopathy is a very common problem in primary care;
  • Since most patients improve on their own (often over a thoroughly miserable 6-12 weeks), the threshold for spine surgeons to operate on this problem (at least in Canada) is VERY high. Surgery is reserved for those with either significant neurologic compromise (primarily motor) or intractable pain after a prolonged attempt at conservative management;
  • Among the small proportion of cases that ever get referred to a surgeon, many referrals will be rejected after the surgeon reviews the patient’s imaging;
  • Among surgical referrals that are accepted, it’s still common for the surgeon, after meeting with the patient, to recommend conservative management;
  • Ultimately, only a small fraction of patients with lumbar radiculopathy will ever be managed surgically. And by the time patients have run the gauntlet to reach that point, they will usually have exhausted conservative management options for their symptoms. In my experience, it’s rare for a patient who finally manages to see a spine surgeon to reject an offer of surgery.

Re conservative management:

  • Evidence for all therapies is suboptimal;
  • Patients’ symptoms often fluctuate for unclear reasons;
  • The overwhelming majority of discussions around conservative treatment occur in primary care clinics. In this setting, decisions are made in a “quick and dirty” manner. We don’t have the luxury of conducting highly granular risk/benefit calculations around questions like whether to try an NSAID or not (or physio or a nerve pain medication). Nothing works very well for this condition and many (?most) patients have one or more absolute or relative contraindications to various treatment options (e.g., NSAIDs). More often than not, we end up lobbing one poorly efficacious treatment after another at the miserable patient while waiting for nature to take its course. And if he doesn’t recover on his own with time, he’s usually so fed up by the time he finally gets in to see the surgeon that he knows pretty clearly whether he’s willing to accept the risk of surgery or not.

I guess what I’m trying to say is that if you want to provide patients with information that they might find helpful in making decisions, the granularity of your proposal needs to reflect the crude realities of therapeutic efficacy, patient triage, and clinical decision-making. A useful approach might be to ask patients who have pursued more invasive treatments (e.g., surgery) to reflect, qualitatively, on their decisions. As a patient in pain, I wouldn’t find it terribly helpful to be told “Fifty percent of patients like you experienced a 40% reduction in their pain with NSAID therapy.” Unless I have a medical reason why I can’t take an NSAID, I’m gonna take the NSAID (and I’ll know pretty quickly if it’s helping or not). But I would appreciate, in the event that I reach a surgeon, being told that “Eighty percent of patients like you who had this surgery say they would make the same decision again” or “Fifty percent of patients like you who were unable to work before surgery were able to return to their previous jobs” or “Ninety percent of patients like you….were able to get off all their pain medications after surgery.”

Best of luck.

3 Likes

Thanks Frank.
I agree with the paper’s point, which aligns with what I argued in the post:

“The MID for a PRO instrument is not an immutable characteristic; it may vary across populations and treatments.” (quote from the paper)

I also like their idea of triangulation. That said, the paper still focuses primarily on anchor-based methods, which I critique as being conceptually limited, especially when used to interpret between-group differences. It also doesn’t address any of the specific methodological or framing issues I’m grappling with.

1 Like

That sounds interesting.

By the way, I tested the approach you and your colleagues used in the Chotai paper on two other datasets of sciatica patients I have access to. The results were similar: baseline explained virtually nothing, while follow-up outcomes accounted for nearly all the variance in patient satisfaction.

1 Like

Thanks David.

I also find it difficult to think in terms of % improvement. Even absolute terms like “2/10 pain” can be hard to interpret without context.

You’re raising a complex issue. I would assume valued activities will vary between patients, and the level of pain someone can tolerate while still functioning meaningfully differs as well - which ties into your point about thresholds. Are you aware of any research that links specific pain scores to functional capacities?

The goal of my study is to interpret whether the between-group differences observed in existing randomized trials comparing early surgery to continued non-surgical care (with optional later surgery) for sciatica are meaningful from a patient perspective. Since those trials used leg pain, back pain, and disability as outcomes, I aim to estimate the smallest worthwhile effect (SWE) for each of these outcomes.

For example, if surgery shows a 2-point greater reduction in leg pain at 3 months compared to non-surgical care, I want to understand whether most patients would consider that improvement sufficient to justify surgery considering its risks, costs, and inconveniences.

I’m not sure how right now how I would directly link that kind of score-based comparison to something like “ability to resume long walks with my dog” or “100% return to normal activity.” That sounds like a binary outcome.

That said, I do think the disability outcome or “pain related physical functioning” as it is sometimes called, measured by the Oswestry Disability Index (ODI), comes closer to what you’re pointing to? It covers domains like personal care, lifting, walking, sitting, standing, sleeping, sexual activity, social life, and traveling. One idea I’ve been considering is to present example item responses that might correspond to an overall ODI score e.g. 30/100 - to make the disability score more interpretable for participants.

2 Likes

I am thrilled to hear that. There is a nice ramification of this: A patient who starts off at a decent level of function who does not worsen is considered a success when viewing the final status as an absolute, yet when considering change from baseline she might be considered a failure.

1 Like

Thanks a lot for your thoughtful and detailed reply Erin. I really appreciate you sharing your clinical perspective.

I think access to surgery and the path patients take to get there varies considerably across countries. I should have mentioned that the survey will be conducted in Germany, where the bar for accessing surgery is much lower than in Canada or the UK. Waiting times are short, and evidence suggests that conservative care is not always fully exhausted before patients undergo surgery.

I completely agree with your points about the depressing reality of the effectiveness of conservative options.

That said, randomized controlled trials in secondary care comparing surgery to continued non-surgical care (after initial conservative management) consistently show that many patients do improve without surgery. In fact, across these trials, about 60% of patients in the non-surgical arms never cross over to surgery - despite having the option to do so (and this are patients who have already tried some form of conservative care).

Regarding your final point. There is already a lot of data on things like return to work or satisfaction after surgery, but these are within-group observations. There are dedicated prediction models for that, ie based on the swedish spine register. However, what’s missing is the contrast with non-surgical care.

That’s where the benefit-harm trade-off method comes in. Rather than asking whether people were satisfied with their treatment, we would present the risk cost and inconveniences of a) continued non-surgical treatment and b) surgery and ask:

“Most people who continue with non-surgical treatment end up with a pain level around 4/10 after 3 months. If you chose to have the surgery instead, how low would your leg pain need to be after surgery for it to be worthwhile compared to that?”

(the exact framing is still being worked out, hence my post; but the core idea of the method is the contrast of two interventions)

This allows to quantify the smallest worthwhile effect as described in the post which can then be used to interpret the effects of existing RCTs.

Would that change any of your thoughts or the way you’d see this kind of approach?

1 Like

Hi Florian

Thanks for your explanation. I see better now what you’re trying to do. Sadly, I don’t know the answer to your questions.

Your point about differences between countries in the threshold for performing surgery is interesting. In countries where spine surgeons are scarce and over-run with referrals (like Canada), wait times for surgical consultation for non-urgent cases are very long. Long periods of conservative management are effectively enforced for all but the most severe cases. For patients in severe pain who are not getting better after many months, these delays in accessing surgical consultations are very frustrating. But, as far as I can tell from a quick review of Uptodate, shorter delays might align well with the paucity of evidence to support longer-term superiority of surgery over conservative management. So if German surgeons are operating very quickly on discogenic lumbar radiculopathy, the question is “why”?

Having personally experienced two spinal disc herniations, both associated with severe pain and 8-12 weeks of significant motor disability and both managed conservatively, I’m still not sure, looking back, if I would have accepted offers of surgery (e.g., microdiskectomy) at the time my symptoms were at their worst.

It seems like the core question your research is trying to address is: “how can we help patients make decisions that will result the least decision regret”? But if even people who know their outcome/trajectory following conservative management can’t judge what they would have done if they had to do it all over again, how accurate can predictive tools really be ?

When you’re in agony, it’s very tempting to accept an offer of potential immediate pain relief. Very few people who pursue an “immediate” solution and achieve rapid relief will say afterward that they regret their decision. Women who have opted for epidural analgesia during labour usually LOOOVE the epidural. But is this really the best group to ask about regret? Among patients with lumbar radiculopathy who are managed conservatively, many of those who muddle through a miserable couple of months and have the luxury to work around any short-term disability will also likely be happy with their decision to avoid surgery (just as many women who choose a “natural” birth don’t regret their decision to forgo an epidural). This phenomenon of “retrospective tolerance” for periods of severe pain (e.g., childbirth, disc herniation), once the experience has passed, is very interesting. Is it even possible to predict decision regret accurately when there are pros and cons to interventions for severe but (usually) temporary pain ?

For discogenic lumbar radiculopathy, maybe the best option is an intermediate approach- give patients a reasonable chance to recover on their own (e.g., ?12-16 weeks). If they are still in significant pain at that point, make surgical consultation accessible in a timely manner (?)

2 Likes

This new article by Ganju looks pertinent: https://onlinelibrary.wiley.com/doi/10.1002/pst.70015?af=R

Perhaps you have already discovered these articles, but Trigg et al (2025) recently presented different viewpoints on conceptualizing the meaningful between-group difference (MBGD). Read also the thought-provoking commentary by Weinfurt. Both articles reject the notion that the MIC could (or should) be used to represent the MBGD. Interestingly, both articles also suggest canvassing input from multiple stakeholders whilst the SWE approach that you are using seems to focus solely on patients’ perspective.

I hope these articles aid you in your quest for MBGD estimation!

1 Like