Comparing multiple groups to a reference group

I would like to compare several groups to a reference group, with the main idea being to show that the other groups are not inferior to the reference. Ideally, I would also like to test for superiority if not inferior.

The sample size is very small: around 20 participants per group. The study was designed without any sample size calculation, and no non-inferiority margin was pre-specified. The investigators, who had no prior experience, concluded non-inferiority simply because the superiority test p-value was >0.05. I should remake the design as not publishable

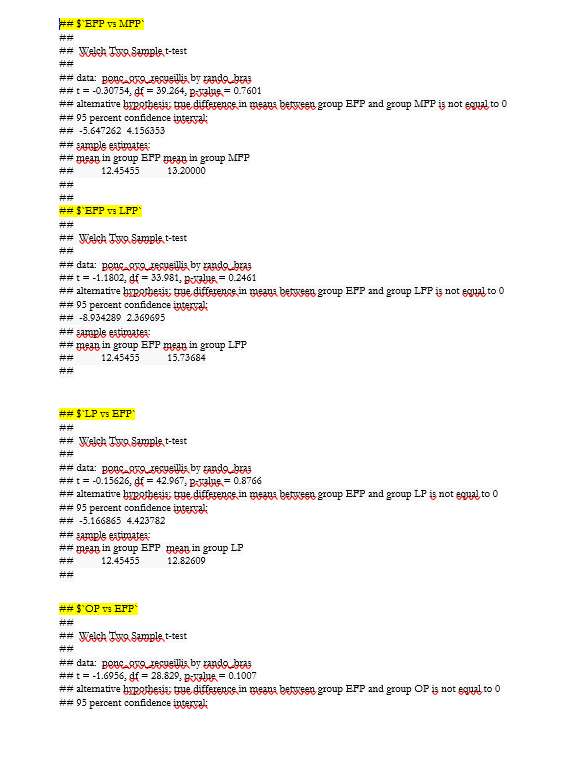
The context is a study in medically assisted procreation (MAP), comparing the number of oocytes retrieved across 5 groups (corresponding to 5 phases of the menstrual cycle).

I have several questions:

  1. Could such a paper be publishable, even though non-inferiority margins were only defined a posteriori?
  2. The working hypothesis is that treatment could begin at any menstrual phase (not necessarily phase 1) without losing efficacy. Therefore, comparisons are only needed versus the first group. Should I run four separate tests? A global test? Should I correct p-values for multiple comparisons? (These should technically be independent tests, right? So no correction required?)
  3. For curiosity: how should I calculate the sample size needed for such a hypothesis? Should I compute the required N for each comparison independently and then retain the largest?
  4. From the observed confidence intervals of the difference between group (too wide), it is already clear that the current sample size is insufficient. I am considering a Bayesian analysis, but I only have theoretical knowledge and have never elicited priors in a real study. What would you recommend regarding priors? Should I set 4 priors for the mean differences in the 4 comparisons? Would that also require 4 priors for the standard deviations? Would non-informative priors be more appropriate? What is the best way to elicit priors without being biased by the current data?
  5. Could such an analysis be implemented in R with JAGS?

The overall idea is to show that the other phases (2, 3, 4, and 5) are not inferior to phase 1, with a non-inferiority margin of 2 oocytes. I also want to test a potential superiority if not inferior (with a delta of 2 oocytes too)
Thank you for you help
Kind regards


All your concerns are good ones. Non-inferiority cannot be included unless it was pre-specified along with a specific non-inferiority margin in the trial protocol.

Bayesian analyses will be easier to interpret
but will not help with the sample size.

Thank you @f2harrell. What could we actually do to make this paper publishable, apart from specifying a non-inferiority margin post hoc? I suppose it would rather have to be presented as exploratory work in that case.

As for the sample size, we only have 102 patients in total, with about 20 per group. Outside of a Bayesian approach, what other methods could we use to allow for a more reliable inference?

Hi,

You do not indicate how the study subjects were allocated to each phase. Were they prospectively randomized or allocated via some other method?

If they were not randomized, you have other material issues to deal with in terms of any inter-group comparisons, and any inference that utilizes confidence intervals, which would be the primary test in a non-inferiority study, not p values, albeit both can be calculated and presented. The challenges associated with the interpretation of confidence intervals in an otherwise observational study were recently discussed here extensively.

You have already essentially indicated that the study was grossly underpowered, so other than presenting this as an exploratory (e.g. pilot) study, even if the subjects were randomized, the ability to engage in any firm inference is going to be highly problematic, as Frank has indicated. I would defer to his expertise vis-a-vis any alternative Bayesian methods that would make sense here, and perhaps salvage the study in some manner.

If you have not yet, I would do a literature search to get a sense for other studies that may have a similar goal to see how they were designed and their conclusions. This is not a clinical domain where I have expertise, but a quick Google search would seem to suggest that, besides the obvious impact of age, which may be a confounding factor, the timing of oocyte retrieval with respect to the maturity of the retrieved oocytes in the setting of any stimulation, and the resultant probability of pregnancy, is relevant.

There may be other study design issues present that can or will impact even exploratory conclusions, such as the inclusion/exclusion criteria, the presence of any relevant comorbid conditions, and so forth.

In terms of calculating a sample size at this point, albeit retrospectively and to perhaps satisfy your curiosity, do you have a sense for the standard deviation of the oocyte counts in the cohort? That will have a material impact on the required sample size.

There are numerous software based (e.g. R) and online non-inferiority sample size calculators available, such as:

where you can see the impact of the SD, given that all other parameters are static and before any consideration of adjustments for multiple comparisons.

For example, using the above online calculator (I get similar results from others), with an alpha of 0.05, a non-inferiority margin of 2, a modest power of 0.8, and a SD of 2, I get a per group sample size estimate of 13. My guess is that this is not your situation.

However, with a SD of 3, the sample size rapidly goes to 28, at 4 it is 50, and so on.

I would just again caution against the use of any post hoc power calculation using your observed data, and present the above more as a general reference for future, prospective, use.

Lastly, if you want to get a sense for the FDA Guidance on non-inferiority trials, you may wish to review this:

https://www.fda.gov/regulatory-information/search-fda-guidance-documents/non-inferiority-clinical-trials

2 Likes

How low are the investigators willing to go, in terms of journal quality? There is no bottom.

5 Likes

In addition to Marc’s excellent suggestions, and thinking of David’s comment, think hard about whether you want to add to an already-littered medical literature. And there is nothing you can do to make this publishable as a non-inferiority study. If you publish it just concentrate on a proper confidence interval
(assuming treatments were randomized).

4 Likes

Thank you, @davidcnorrismd ,for your response. Regardless of the journal’s quality, my main priority is that the results are interpretable (Something scientifically acceptable). I am fully aware of the limitations of our inference in this context (it should probably be considered exploratory rather than confirmatory), since nothing was pre-specified in advance. However, I would still like to extract meaningful information from this study.

The non-inferiority margin is clinically relevant (based on the literature) and defendable I think, even though we have already seen the data. Nevertheless, I already know that even with this equivalence margin of two oocytes (The other phases should not be lower by more than 2 compared to the phase 1), the confidence intervals for the group differences are so wide that no conclusion can be drawn. The result is therefore non-conclusive.

I would really like to salvage this paper. (The standard frequentist approach doesn’t seem to help much — should I consider bootstrap methods? Or a Bayesian approach instead? ) I don’t want a journal to end up accepting it in its current form with misleading conclusions — we have already received several rejections. The investigators believe that a p-value > 0.05 from a superiority test (the p.value provided by default) confirms their non-inferiority hypothesis, which is incorrect.

I didn’t even try to calculate the specific p-value for the inferiority test, as I thought it wouldn’t provide any meaningful insight. Below are the confidence intervals for the differences between the first phase and the others (patients were randomly allocated to different phases). The early follicular phase (EFP) is the reference group.

Hi,

You appear to be using the incorrect incantation for the t.test() in R vis-a-vis a non-inferiority test.

Your code in the screen capture is estimating a two-sided t.test and 95% confidence intervals for a null hypothesis that the mean difference is 0, and the alternative hypothesis is that the mean difference is not equal to 0.

What you want is a one-sided test with a null hypothesis that the mean difference is less than or equal to -2 and that the alternative is that the mean difference is greater than -2.

I don’t have your data, but generating two sets of 20 measurements, presuming a normal distribution, with means of 12 and 13 respectively, both with SDs of 3:

set.seed(1)

DF.G1 <- data.frame(Grp = "Con", Parm = rnorm(n = 20, mean = 12, sd = 3))

DF.G2 <- data.frame(Grp = "Exp", Parm = rnorm(n = 20, mean = 13, sd = 3))

DF <- rbind(DF.G1, DF.G2) 

Now, run the test as I define above:

> t.test(Parm ~ Grp, data = DF, alternative = "greater", mu = -2, conf.level = 0.95)

	Welch Two Sample t-test

data:  Parm by Grp
t = 1.8789, df = 37.917, p-value = 0.03398
alternative hypothesis: true difference in means between group Con and group Exp is greater than -2
95 percent confidence interval:
 -1.836678       Inf
sample estimates:
mean in group Con mean in group Exp 
         12.57157          12.98059 

So, reviewing the above results, you can see that the lower bound of the 95% one-sided confidence interval is -1.836678, which is above your non-inferiority margin of -2, and the one-sided p value is 0.03398, which is below 0.05.

Note that the upper bound of the confidence interval is set to “Inf” as a default, because it is not relevant here.

Thus, for the hypothetical data above, you would reject the null hypothesis that the experimental group is not non-inferior to the control group. That sounds like a double negative, but that is the null hypothesis for a non-inferiority study.

As I noted in my prior reply, it will all come down to the SDs of the groups in your actual data as to whether or not you have sufficient power to achieve a result consistent with your non-inferiority hypothesis in any of the comparisons. You can see that with SDs of 3 above, in this one simulated dataset, the lower bound of the CI is close to -2, so with more dispersion of your actual data, you will be increasingly less likely to reject the null with an alpha of 0.05.

Depending upon what the above approach shows with your actual data, and should you decide that you do want to engage in post hoc adjustments for multiple comparisons, such as Dunnett, which is intended for the setting where you are only concerned with comparisons of each experimental group versus the control, you can look at R packages such as “emmeans” by Russ Lenth, which can provide for simultaneous adjustments of p values and confidence intervals, with the obvious impacts on the lower bounds of your confidence intervals and p values.

On the publication topic, a couple of thoughts, and generally in line with David’s comments above vis-a-vis the nature of the journal that might be willing to accept this study for publication, notably since it has already been rejected multiple times. In the context of a pilot study with preliminary findings, you could consider using a “looser” alpha level, such as 0.1, in which case you would want to use 90% one-sided confidence intervals. Yet another option, besides a journal, would be to present this study as a poster at a relevant meeting, where there is not typically a formal peer review process, and where the abstract for the poster might be accepted given the interest level of the meeting’s abstract review panel.

Note that the above suggestions do not take into account that the post hoc analyses are not consistent with the improperly designed study protocol, which is going to be a barrier, as Frank has rightly referenced.

3 Likes