Examples of clinical prediction rules which perform better without dichotomisations

There are strong philosophical and statistical arguments against dichotomising continuous and ordinal variables for the purpose of clinical prediction. These arguments have been extensively discussed elsewhere here on datamethods.org and do not need to be restated here. I have however not yet come across papers which directly compare established clinical risk prediction rules which contain dichotomisations with their continuous counterparts. I wanted to ask the community whether they knew of such papers and could provide links to them here and regardless - whether there are any obvious hindrances or methodological issues designing such a study?

I would generally be interested in any and all discussion, but I also have specific reasons for being interested in this topic. I am currently working on a prospective independent validation of the HEART Pathway for Early Discharge in Acute Chest Pain. I am exploring whether the study data could also be used to compare the current dichotomised version, to one in which all continuous clinical predictors are kept continuous. I would also like to compare predictive ability of the HEART pathway to itself using only troponin values at times t=0, and t=1 hour, compared to t=0 and t=3 hours.

2 Likes

I hope we get several replies. This is very easy to do in parallel with any paper where the authors are tempted to dichotomize one or more predictors. Here are some approaches:

  • compute an overall likelihood ratio \chi^2 goodness-of-fit statistic, i.e, the difference in -2 log likelihoods from a full model that splined all continuous variables and included the dichotomizations and a model that only used dichotomizations
  • show the distribution of absolute difference in predicted risk from a continuous model and a dichotomous one
  • measured the added value (-2 log likelihood) from using a key variable continuously and see if that value is on the same order of magnitude as what some of the other variables in the model contribute (i.e., see if dichotomizing the marker is equivalent to undiscovering another marker)
  • plot the staircase form of predicted values from dichotomization and see if the discontinuity it assumes is clinically plausible (it will never be)
3 Likes

I have done this now in several analyses but not published the comparison - substantial loss of auc and net benefit from the simplified version of the predictor (the categorized version one can use without help of their phone) compared to the continuous version. Easily matches the value one gains from an additional predictor (or several). Despite this there remain many scenarios where dichotomization is more practical for clinical use than stopping to use an app. Having said that, I find that reasonable clinicians use cutpoints and absolute values together - you want to know what is “abnormal” but interpret a bit abnormal differently than very abnormal. The approach just isn’t explicit and makes for variability in decisions from one practitioner to the next.

Statistical measures of calibration and descrimination (or some combined measures like net benefit and Brier) will never settle this question for the medical community. What we need are some actual studies where people are randomized to use each version of the prediction guide. Even it not a real clinical study assessing patient outcomes, a study with standardized scenarios given to physicians might be informative.

I would be up for collaborating on such a study.

5 Likes

I really like you said in the first paragraph. Regarding the 2nd, such studies would be indeed valuable but it strikes me that the bar is much, much lower for studying new biomarkers and diagnostic tests that what you describe for assembling evidence that a bad analytical method leads to worse decisions. Still I’ll like to see it done. Short of that, some real examples where gains in predictive information were completely offset by losses in information from dichotomizing basic clinical variables would go a long way. I have an example very similar to that in the Information Loss chapter of BBR where the prognostic value of ventricular arrhythmias equals the amount of information that would be restored had LVEF been used continuously instead of dichotomized at 0.4 as done by the original authors.

Your point about variability of how clinicians use things such as “a bit abnormal” or “very abnormal” is very important and I haven’t looked at that enough. I did make a comment in my book Regression Modeling Strategies that categorical variables are more likely to have between-hospital standardization issues than continuous variables.

2 Likes

It’s an interesting task to undertake Elias. I was doing something similar the other day using dichotomised troponin, ecg, and a risk score variable and comparing it to a model with each component of the score entered separately and troponin as a continuous variable. I constructed logistic regression models for each to get the predicted risk for each patient (with some interactions). The AUCs were similar, but the predicted risks were very different (figure)! You may want to try something similar.

Stratified%20v%20continuous

3 Likes

We show benefit of continuous covariates with Gaussian process Cox proportional hazard model versus three different discretized risk scores for predicting Gastrointestinal stromal tumour (GIST) recurrence during the first 10 years of follow-up after surgery (Sorry @f2harrell, at that time I didn’t know better and we used (cross-validation) AUC as the comparison measure in the paper).

Joensuu, Vehtari et al (2012). Risk of recurrence of gastrointestinal stromal tumour after surgery: an analysis of pooled population-based cohorts. The lancet oncology, 13(3), 265-274. ResearchGate

We have also online risk calculator, so it’s easy to use http://gistrisk.com/

4 Likes

Nice. More direct IMHO would be to show calibration curves, then if all models are reasonably well calibrated, show scatterplots with x=prediction from a simpler model and y=prediction from a more flexible model.

Great reply. I wonder how such a randomization would work given that a dichotomized clinical prediction score has already been developed and validated. I imagine that the effect size of a continuous rather than dichotomized model would be small and the sample size required to detect any difference huge.

1 Like

My feeling is that you don’t need a randomized study to demonstrate the impact of making an error in model specification that creates significant lack of fit. It’s much easier to show that (1) the predictions from a continuous model are better and (2) the predictions between a continuous and a discontinuous effect will significantly disagree with each other when the continuous value is not near the mean of values within an interval. Perhaps more convincing to clinicians is to show that (1) dichotomizing a strong continuous marker is the statistical equivalent of undiscovering a biomarker and (2) not dichotomizing some markers would have made other markers obsolete.

:new: 
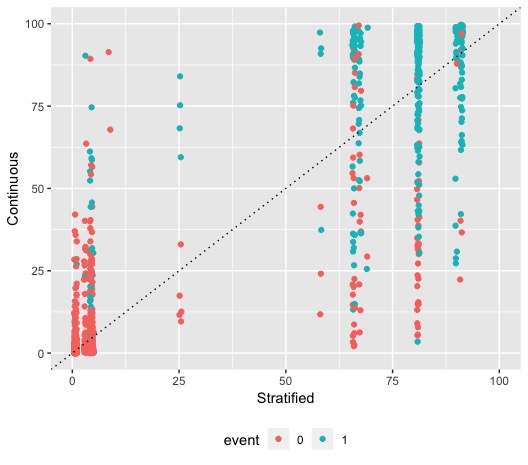
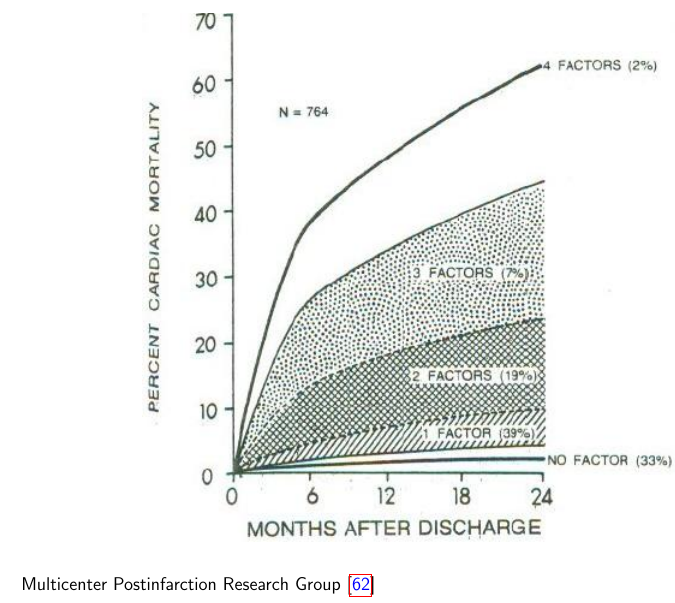
Here is an example from the
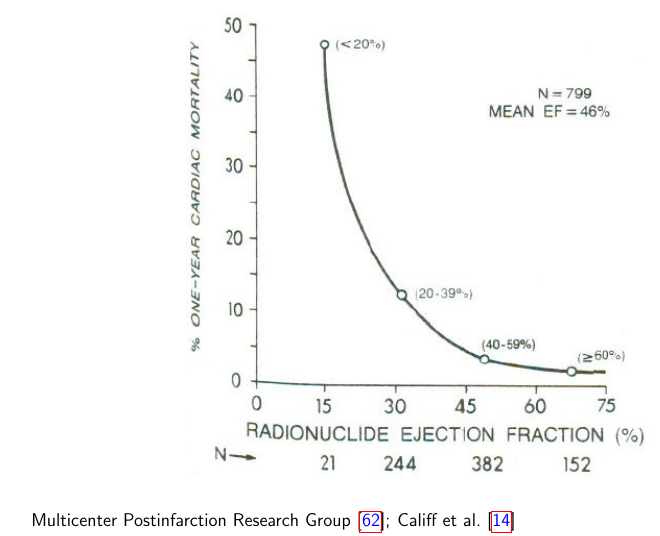
 BBR Information Loss chapter in which the predicted risk of prostate cancer recurrence post resection is computed for the same man using a variety of models with and without dichotomization. You can see the kind of difference in predicted risk results.

:new: Here is another example from that same chapter in BBR. In this example, authors of a paper to predict mortality risk post myocardial infarction had developed a risk score that unfortunately involved rampant dichotomania. The example below shows that only one of the ocmponents of this score, when respected as a continuous variable, contains the same risk spectrum as the entire score.


Focus on the one-year mortality estimates. Ironically the spectrum from 0.03 to 0.47 from the risk score is the same as that from LVEF alone! Dichotomizing the most powerful predictor resulted in huge information loss, especially when counting LVEF=20 the same as LVEF=40.

2 Likes

Take a look at this paper we published in 2016 in Statistics in Medicine https://onlinelibrary.wiley.com/doi/epdf/10.1002/sim.6986

We carried out a comparison of various approaches for handling continuous predictors in prediction models (as a function of sample size), from simple dichotomisation, categories (from 3 to 5 categories), assumed linear, and modelled with restricted cubic splines and fractional polynomials.

Substantial loss in predictive accuracy as expected with dichotomisation (in terms of model discrimination, calibration and net benefit). The effect will be more profound the stronger the predictor.

Bottom line - it is anti-science, and you are throwing important information away by dichotomising continuous predictors.

6 Likes

So are you cautioning against Fast and Frugal Trees? There is a R Package by Nathaniel Phillips et al that determines a Fast and Frugal Tree and can compare to a logistic regression model (among other models).

1 Like

The one thing that is really painful for my practice as a transplant nephrologist , which also has direct implications for organ transplant is the at the arbitrary classification of kidneys as “high” vs “not-high” risk using the KDPI risk indicator.
Like Cinderella, a kidney put up in the UNOS list is deemed a high risk (KDPI >85) requiring special informed consents. Many of these kidneys which would have worked (albeit not right away) are being discarded.

Background on KDPI
https://optn.transplant.hrsa.gov/resources/guidance/kidney-donor-profile-index-kdpi-guide-for-clinicians/

(Sorry I had to vent)

3 Likes

Yes I’d caution against. For stability this method would require > 100,000 patients, and it doesn’t handle continuous variables properly. Since for the latter it seeks a cutpoint and the cutpoint doesn’t exist in nature, every study will find a different cutpoint.

I’m so glad you are venting about this. This seems to be a perfect example of how arbitrary classification leads to poor decision making and doesn’t recognize that near the boundaries, other variables need to be used in a compromise assessment. To make matters worse, I’ll bet that there are no data anywhere that actually justifies the choice of 85 as a cutpoint.

2 Likes

I’m new to this forum, so let me know if this reply should go somewhere else.

I understand the criticisms about losing predictive power with dichotomization of predictors, but I think you’re missing the point of dichotomization, and why it is used so often in the clinical world. As clinicians, we don’t walk around the wards and clinics carrying calculators so that we can enter each variable of data into our model and then get a predictive score. 95% of management decisions are based on whether the predictor falls into a predetermined category, which for each provider is something that can be learned, memorized, and applied clinically in an efficient manner across a large number of patients. Is the blood pressure greater than 140mmHg? Are there more than 40% cancerous cells on the specimen? Is the left ventricular ejection fraction under 30%? These dichotomizations are necessary for practical application of predictors to treatment decisions.

I think this thread is missing the point that comparing a prediction model that contains a dichotomized variable with one in which it is continuous will be a useful demonstration of the weakness of dichotomization. The true comparison would be the application of a model in the real world. Can you give me an example of a prediction model based on continuous variables that is applied everyday in clinical practice?

2 Likes

I can’t speak to specialities outside of neonatology, but I would wonder whether you need to make these decisions with the speed that a dichotomized variable allows. I would turn the question around and ask if you knew that these easy to memorize decision points were harming your patients and an alternative tool was available but took an extra two or 3 minutes to use, would you still use the easy to memorize version?

Here’s one used routinely by at least a couple neonatologists I know. The attached paper has strengths and weaknesses but the general idea is there.

1 Like

This is no longer used in the real world, but the cardiac arrhythmia example given above is to me a great example. By dichotomizing LVEF in the risk score, the model was not properly adjusted for LVEF (i.e., there is residual confounding), which made ventricular arrhythmia get positive weight in the risk score. Had LVEF been treated as a continuous variable, the premature ventricular contraction frequency would have been found to have zero weight. So we know know that PVCs were not an independent risk factor for cardiac death. The assumption that it was an independent risk factor helped lead to the development of anti-arrhythmic drugs that turned out to kill more patients than they saved.

This is a good point, except for the facts that

  • simple nomograms can be quickly and easily used and have been for > 50 years in medicine
    • body surface area and body mass index have been computed this way for decades, with no need to first dichotomize height and weight
  • there are many cases where a single continuous variable, when not carved into intervals, yields a better clinical assessment than a series of over-simplified binary categorizations. PSA is a pretty good example of that in the above prostate cancer recurrence example. The LVEF example is a perfect one to illustrate the point.
  • prediction tools are been added to the electronic health record to automatically do the needed computations for continuous models

So my $.02 worth is that we need to talk more about feasibility, implementation, and finding more examples of the second point above. In the age of personalized/precision medicine, the idea of using group estimates (e.g., for intervals of LVEF and not for the patient’s specific LVEF) is even more problematic than in the past. We see examples where clinicians seek genetic refinement of risk but these refinements may just be making up for information lost by not respecting continuous patient characteristics.

There is a more general lesson in all this. Risk can be arrived at in various ways, and often a patient is at high risk because of borderline values of a number of variables. Risk is what drives optimum medical decisions, and risk comes from

  • an extreme value of a single dominating predictor
  • moderately high values of two or more predictors
  • slightly high values of multiple predictors

and many more combinations. These all involve compromises. To make the right compromises requires not simplifying each predictor up front.

4 Likes

Thanks for replies!

You won’t find any argument out of me that we should be trying to incorporate better prediction models into the clinical decision making process (continuous, nonlinear, deep learning, rather than dichotomized variables), and this is actually a major focus of my own research. The bad news is that it seems to involve spending a lot of time thinking about interfacing with the electronic health record system for our hospital (Epic…ugh!), rather than developing the models themselves, although we’re trying to do both.

There are definitely apps and websites that will perform calculations for you, everything from BMI and correcting the QT interval for heart rate to calculating the risk of sudden death for patients with hypertrophic cardiomyopathy (European Society of Cardiology). The problem is that those 3-5 minutes to break away from the patient and EHR to log into the separate site and enter data can add up over the course of a busy clinic. However, there’s another major reason that dichotomous variables are often of interest clinically, which is that most major clinical decisions these days are tied to clinical trials whose enrollment criteria almost have to be dichotomous. The reason we use LVEF less than 30% for a defibrillator implantation is that that was the cutoff used by the MADIT-II trial, which showed a benefit in that population. There are many, including myself, who have argued that some of these enrollment criteria are too broad, and that the real ‘benefit’ in these trials was in a select few (the NNT for these trials in generally in the 30-50 range, which is pretty high for inserting a foreign object that carries a lifelong risk of infection). However, I imagine I don’t need to explain to this group why RCTs are superior to observational studies in guiding decision-making based on causality, and so we’re often left using the simple, dichotomous cutpoints.

There are two angles that I think are worth pursuing, assuming that we can develop the technological framework to implement better risk models into the clinical workflow. One is to start to design RCTs in which a risk model is used to determine enrollment. This is, I believe, the goal of the use of polygenic risk scores, in which case one would select a cutpoint based on genetic risk. Ironically, these studies have drawn some of the strongest criticism for reporting results in dichotomized fashion, but ultimately this is probably how we would apply PGS clinically. The second is to develop real-time clinical decision support tools using risk prediction models built into the EHR, which would run in the background on patients and only fire when a given patient’s risk rose above some threshold for which action would be required. Our institution is lucky in that we have EHR/Epic developers who are willing and interested to pursue these types of projects through the Epic interface, but I think there’s a lot of work to do before we understand how to make these tools useful and not just added noise. I’ve actually be spending a lot of time studying methods in reinforcement learning and A/B testing in IT development to find a way to roll them out without angering my clinical colleagues.

This is an exciting time because I believe all of the components are there to actually apply accurate prediction models to improve patient care efficiency and outcomes, it’s just a matter of bringing together the people and resources. My bias is that ultimately it will come down to the models themselves, and ‘proving’ that there are more accurate ways to predict disease, which is why I’ve tried very hard to engage data scientists and statisticians in the process. I’m always open to suggestions and ideas, so please let me know if any thoughts (other than “You should talk to Google”, which I’ve had a couple of clinical colleagues suggest…:slight_smile:

3 Likes

These dichotomizations are necessary only to the practice of medicine organized around a “misplaced faith in the completeness and accuracy of [physicians’] own personal store of medical knowledge and the efficacy of their intellects” [1]. To criticize what @f2harrell proposes as incompatible with the current practice of medicine may even amount to a petitio principii, since fundamental changes to the practice of medicine may well be what is required, if we accept Frank’s arguments! Apropos of all this, Larry Weed’s “Physicians of the Future” [2] is 4 pages of pure genius that is almost painful to quote except in its entirety, but here goes…

It should be noted, however, that ‘clinicians’ are not the only offenders in categorization. Statisticians are guilty also, and their ideas do not always serve well the physician’s ethic of caring for the individual patient. There was an interesting exchange [3–5] awhile back in JAMA, about which I commented here. Regarding the supposed ‘difficulties’ of incorporating modern predictive modeling into medical practice, I had the following to say in closing:

The authors conclude by calling on physicians to mop up this shambles. They utter the shibboleth, “models cannot replace the physician,” then incant some vague magic by which physicians should restore the individual patient to a scheme that has excluded the individual from its very epistemology. Mathematically, the requisite magic translates to conditioning on individuals after frequentist methods have already averaged individuals out.

The ‘art of medicine’ has long enough been defined by quixotic attacks upon mathematical impossibilities. Physicians of the future will gladly relinquish the merely computational tasks of medicine to predictive models and other forms of automation. They will rather find a purposive role in the creative, irreplaceably human endeavor of helping patients to formulate their medical decision problems in alignment with their values and circumstances, and to decide these problems in accordance with appropriate evidence drawn from ever-improving predictive models.

  1. Jacobs L. Interview with Lawrence Weed, MD— The Father of the Problem-Oriented Medical Record Looks Ahead. Perm J. 2009;13(3):84-89. http://www.ncbi.nlm.nih.gov/pmc/articles/PMC2911807/

  2. Weed LL. Physicians of the Future. New England Journal of Medicine. 1981;304(15):903-907. doi:10.1056/NEJM198104093041511

  3. Sniderman AD, D’Agostino Sr RB, Pencina MJ. The role of physicians in the era of predictive analytics. JAMA. 2015;314(1):25-26. doi:10.1001/jama.2015.6177

  4. Van Calster B, Steyerberg EW, Harrell FH. RIsk prediction for individuals. JAMA. 2015;314(17):1875-1875. doi:10.1001/jama.2015.12215

  5. Sniderman AD, D’Agostino Sr RB, Pencina MJ. Risk prediction for individuals—reply. JAMA. 2015;314(17):1875-1876. doi:10.1001/jama.2015.12221

3 Likes

There are some data but basically the cut off point is somewhat arbitrary ie as it identified “extended criteria donors” based on a previous binary clinical classification scheme.

There is really no reason to have a cutoff - the risk is continuous and in my mind leads to higher discard rates after a long process that impedes the chances of such donated organs to work (the longer they stay out of the body, the less likely they are to work)

1 Like