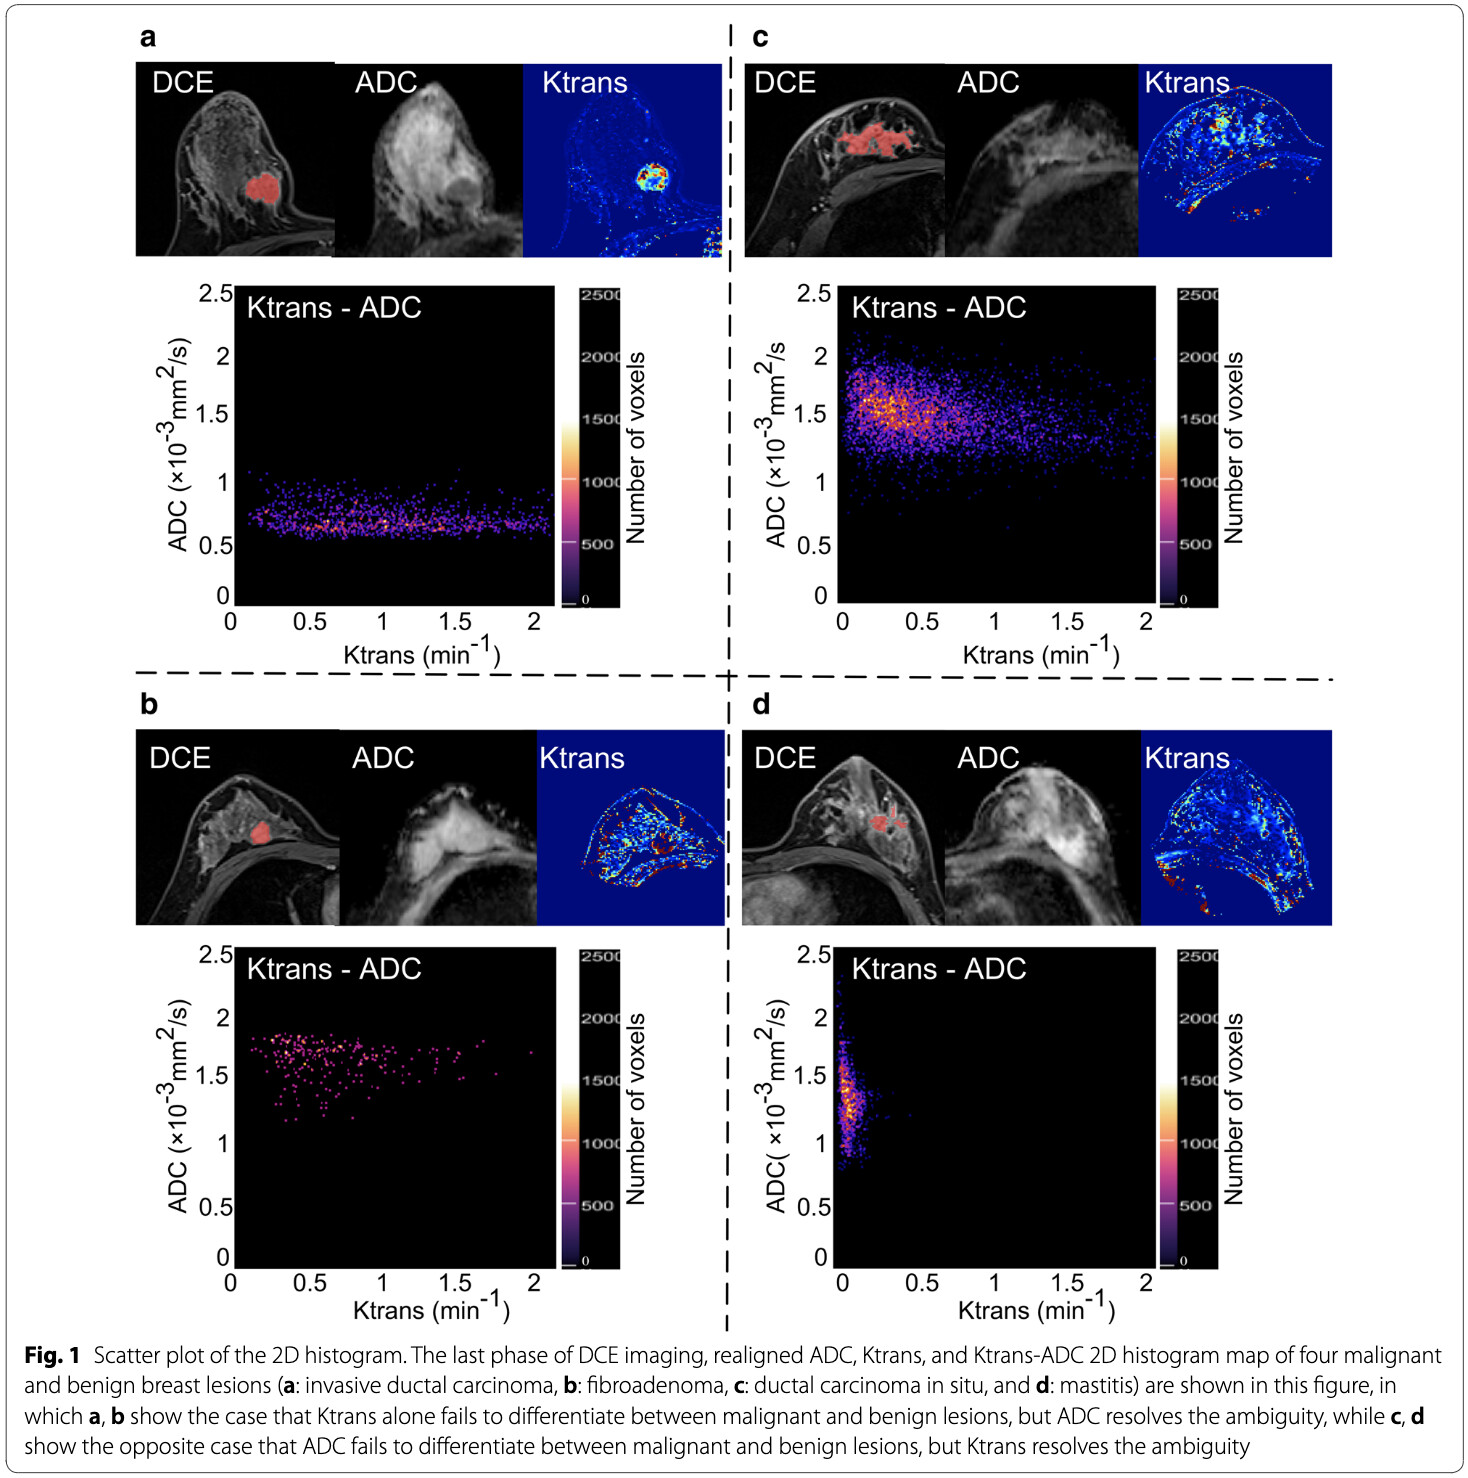
I was reading this paper in the medical field which proposes a method using two radiological parameters in order to distinguish benign and malignant lesions. In their paper the Authors show this plot
They show after in the results that skewness and kurtosis of these lesions is different between benign and malignant lesions. I’m wondering how the calculations are performed. Are they referring to Mardia’s multivariate skewness and kurtosis? Are there any methods to calculate in R bivariate skewness and kurtosis other than Mardia’s?
From the paper:
Blockquote
Methods: This study included 116 patients with 72 malignant and 44 benign breast lesions who underwent CAIP IRINHA-Dixon-TWIST-VIBE dynamic contrast-enhanced (CDT-VIBE DCE) and readout-segmented difusion-weighted magnetic resonance examination.
Discussion of skewness or kurtosis with these very small sample sizes strike me as fundamentally mistaken. I’m reminded of the following 2 articles from Quality Digest by statistical process control expert Donald J. Wheeler:
Wheeler, D (2011) Problems with Skewness and Kurtosis: Part 1 Quality Digest (link)
Wheeler, D (2011) Problems with Skewness and Kurtosis: Part 2 Quality Digest (link)
(Both articles are accessible if you provide an email for their list).
These two articles provide the formulas to calculate skew and kurtosis and shows the relationship to the standard deviation. The mean, the variance, skewness, and kurtosis are the first 4 moments of probability distributions and play an important role in statistical theory.
The articles also show why shape statistics are hardly used in practice.
Suffice it to say – the small samples reported in the paper do not have enough information to estimate either of the shape parameters. I’m not sure what was learned from the study.
1 Like