Today I had a discussion with one of my clinical colleagues about how to proceed with heavily skewed paired data.
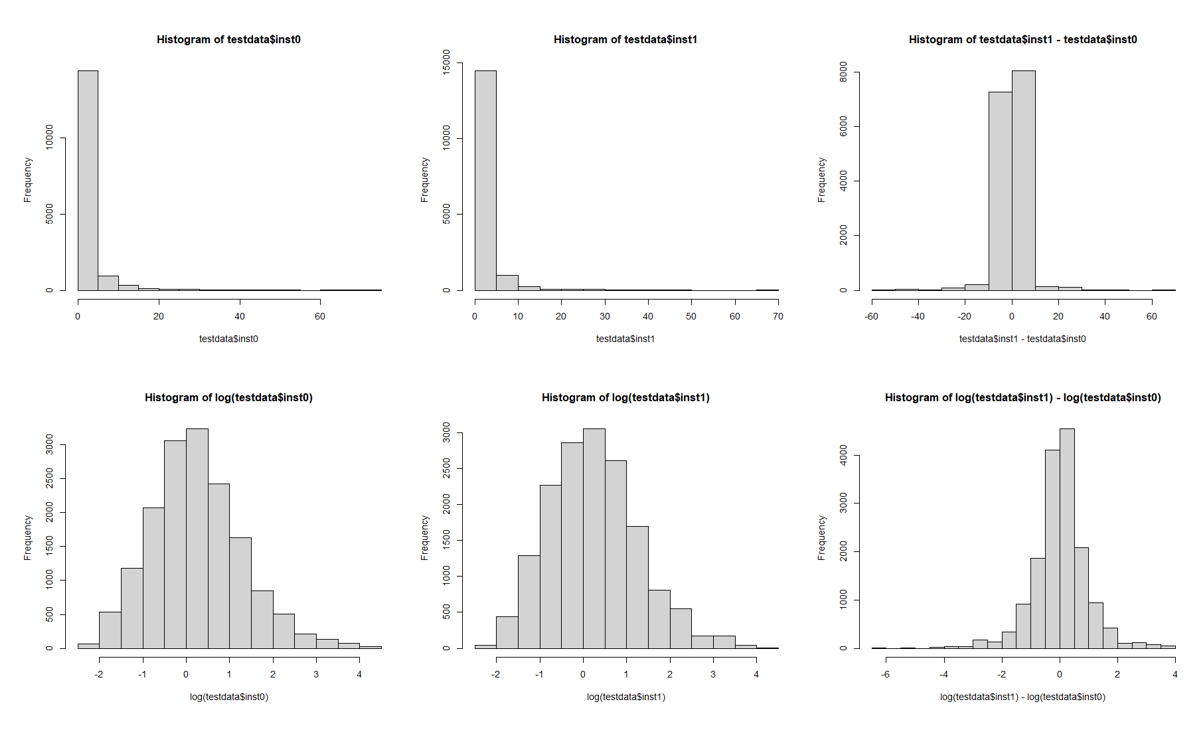
So the data looks like:
Instance blood-value
0 1.3
1 0.2
0 1.8
1 1.9
The values are all >0 and can go up to 300.
The histograms look like:
(first row non log values, second row log’ed values, 3rd column is difference)
What would be the best way to test if the difference in blood-values differs from 0?
The blood-values are paired, so 1 value at 2 timepoints for every patient. The sample size is large (N=20.000).
Would it be a paired t-test of the difference? Or a t-test of log(inst1)-log(inst0) != 0? Or even another way of comparing those?
Just by looking at the boxplots/violinplots they look the same. But there are some patients going heavily up and some going heavily down.
There are several issues at play here – for me (without knowing the biology) it seems pretty clear that the quantity under measurement is lognormal, and hence it makes most sense to consider differences on a ratio scale as that is how the underlying phenomenon “operates”. That would suggest analysis on the log-scale.
I was recently pulling together some resources on log transforms for assay-type measures, so have a few references to hand. This paper by Motulsky et al. is long (still in pre-publication typesetting, should be open access), but sets out the rationale and justifications very clearly and progresses very logically: there is even a section on paired analysis (section VIII.A) https://www.sciencedirect.com/science/article/pii/S0031699725074575
The chapter in Motulsky’s “Intuitive Biostatistics” textbook on analysis of lognormal data analysis summarises these issues as per the above paper but more succinctly. If you can get hold of that book it will be quicker to read, and when I first read that I found it really clarified many analytical and interpretation points.
As a p.s. on this point – this would also seem diagnostic of log-normal data… that the absolute [paired] differences can be very large or small depending on where someone sits on the distribution, because the variable is operating in a fashion that differences need to be considered as ratios rather than absolute differences.
So when a variable is operating in this fashion e.g. a paired difference from 10 to 20 – absolute difference 10, ratio of 2 – should be considered equivalent of a change from 100 to 200 – absolute difference 100, ratio of 2.
A concentration of some kind, I presume? This is why our first encounter with logarithmic axes typically happens in high school chemistry. Logs are pretty hard at that age, but they’re indispensable in dealing with concentrations. (The pH scale is logarithmic too.)
thanks for the literature. Will have a look at this.
And yes, my gut feeling is also, that these data is lognormal.
What made me wondering was, that even log transformation does not bring the difference visually towards gaussian curve. But the transformation of log(inst1)-log(inst0) is the suggested “log ratio test” in your attached link.
Another point, which has nothing to do with this special part was also part the discussion:
The sample size is that large, that even the smallest difference (lets say for example 0.1, while values are 0-200) is significant. How do we report this “best” to clinicians, cause they always look at the p-value and are partying (or horrified) if a p-value is significant, not looking at the difference estimator for example?