Dear all experts,
I am working with a Cox proportional hazards model where a biomarker has been log-transformed, and I am trying to interpret the hazard ratio in a way that is intuitive for non-statisticians.
For example, if the hazard ratio is 1.2, the standard interpretation is that a one-unit increase in the log-transformed biomarker is associated with a 20% increase in the hazard of the event (e.g. healing).
However, this is difficult to communicate because a “one-unit increase” on the log scale does not translate easily into changes on the original biomarker scale.
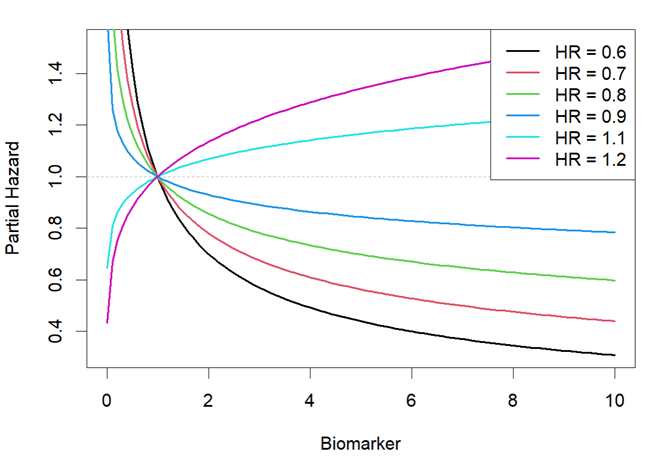
To improve interpretability, I have plotted the estimated partial hazard (not account for baseline hazard) against the original biomarker values for different HR values. Based on the plot shown below, my interpretation is too technical (in my opinion): The plot reflects the effect of the log transformation on the hazard: the same absolute change in biomarker level results in a larger hazard difference when it occurs at lower values, where the curve is steep, than at higher values, where the curve is flat. The direction of this contrast, specifically whether lower biomarker values are associated with higher or lower hazard, is determined by whether the model HR is less than or greater than 1. As expected, the steepness of each curve, and therefore the magnitude of the hazard contrast for a given absolute difference, depends on how far the model HR deviates from the null value of 1.
My question is: Are there better or more interpretable ways to express the effect of a log-transformed biomarker on the hazard, preferably in terms of changes in the original biomarker values, rather than a one-unit change on the log scale?
Thank you so much in advance.
1 Like
I’m not sure if my understanding is correct.
Log transformation is often used when the original scale changes proportionally rather than numerically. It flattens the multiplicative curve into an additive straight line.
If you’re looking for an interpretation of the log transformed value as if it were an additive continuous value, the simple approach is to use a base of 2 instead of a natural number. This calculates the hazard ratio as the risk changes when the original scale doubles. For example, a hazard ratio of 1.2 means the risk change when the original scale increases from 10 to 20 (from x to x * 2). This is commonly used when antibody titers are significantly left-skewed and have a very large range.
If the variable’s range isn’t very large, you can use the ln(1+ x) power of the hazard ratio. For example, if x is 10%, this means the change in hazard ratio when the original scale increases by 10%.
In other words, it converts the additive interpretation of the hazard ratio into an interpretation based on the proportional change of the original scale. This applies if the original scale changes proportionally. If not, I guess a nonlinear RCS might be better.
3 Likes
An alternative would be to recognize the log-transformed quantity by its own name. Consider the pH, which is familiar to everybody in medicine.
2 Likes
Many thanks, Jiaqi and David, for your guidance.
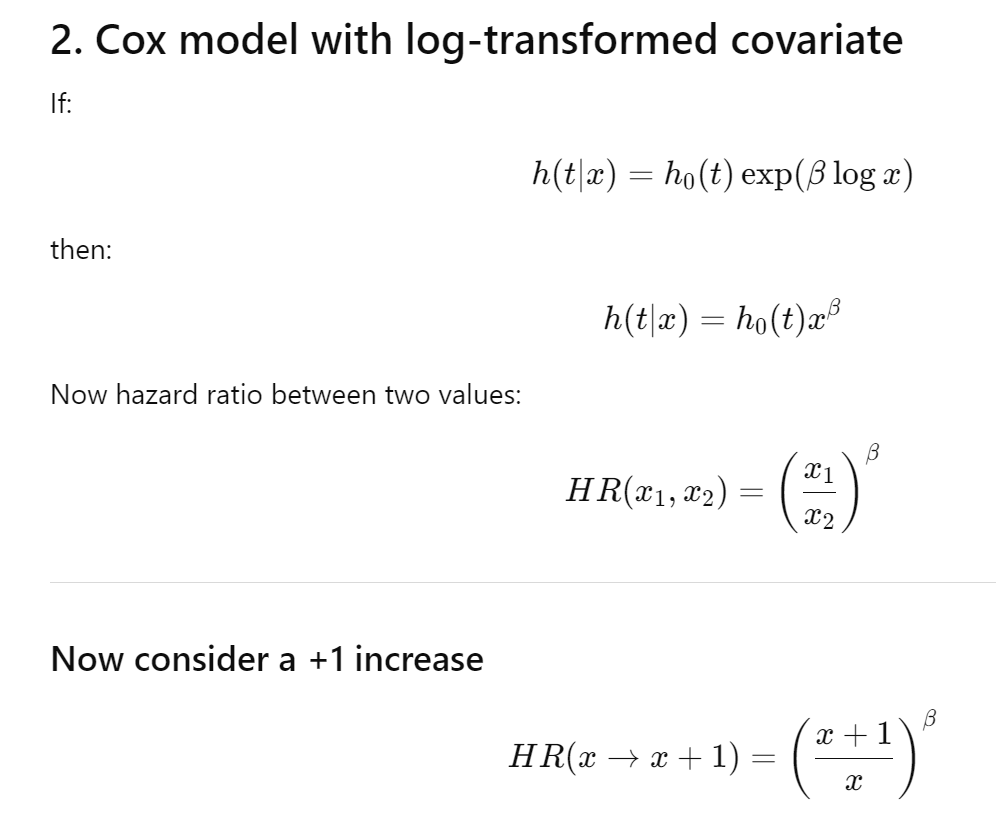
I think I get it now, after log transformation, the hazard ratio depends on the ratio x1/x2 and the log-hazard coefficient. A proportional change in x (e.g., doubling or tripling) corresponds to a constant hazard ratio that does not depend on the reference value of x. In contrast, an absolute increase in x (e.g., an increase of 1 unit) produces a hazard ratio that depends on the reference value of x, because the effect is determined by the relative change 1/x and beta.
I wouldn’t trust log transformations, instead opting for restricted cubic spline functions of log values. To describe the results make partial effect plots and compute inter-quartile-range effect ratios as described here.