I'd be interested in any views on this attempt to predict COVID-19 hospitalizations using SARS-CoV-2 concentrations in wastewater (sewage)

There is keen interest in public health in the use of incoming wastewater (i.e. pre-treatment sewage) for disease surveillance–particularly in predicting meaningful outcomes like rates of new hospital admissions. This is made technically feasible by the increasing sophistication and sensitivity of molecular methods to detect even tiny amounts of a pathogen’s RNA or DNA. I can certainly see the value in the concept: wastewater can be collected and assayed for pathogens relatively easily, and it does not depend on human behavior. For example, you can test sewage influent for SARS-CoV-2 RNA regularly, regardless of whether people in the community are getting tested.

Here is one example from my state, currently in preprint:

I’d be interested in any opinions about the methods. There’s a lot here, and I’m still working through the manuscript, but my initial, vague thoughts, possibly misguided, are:

  1. It’s a lot of model-fitting. Over-fitting?
  2. The researchers say they used stepwise methods for variable selection
  3. I’d think there’d be much collinearity between some of the predictors. Effect on stability of coefficient estimates?

Thanks.
–Chris Ryan

1 Like

:roll_eyes: :scream_cat: :see_no_evil:

2 Likes

Caveat: Not an expert in COVID-19 or public health predictive models.Not a card-carrying statistician, so no motions to revoke my certifications will be considered. 30+ years experience in analytics & “decision support” in health care systems.

I see RNA prevalence in the wastewater … however measured, and I find the difference choices in methodology to be intriguing but waaaaay above my knowledge level … as a DIRECT MEASURE of disease prevalence in the community, and as LEADING INDICATOR of hospital admissions.

What value, in a practical sense, do the various demographic and regional “risk predictors” add to that? I would argue: very little.

The core requirements for a PREDICTIVE model of this type IMO are (1) directionally accurate (2) responsive to short-term changes and (3) available quickly enough to be useful “by decision-makers” for staffing and reponse planning.

In retrospective model-building looking back two years, all of the county and regional variables … test rates, immunization rates, etc … are readily available. However, in a production “real world use” situation, the entire suite of those variables may not be available in a timely fashion, every week. Or twice-weekly. Then what do you do?

I’d model only the relationship of RNA levels and hospital admissions. And get twice-weekly measurements from all the waste-water treatment facilities to tighten up the detection windows for changes in trends.

Doug–

Big picture, I think the hope is to do exactly what you describe toward the end of your post: predict upcoming hospitalization burden using only surveillance of the RNA concentration in wastewater (WW). WW can be collected (easy) and then assayed for RNA (pretty easy) at any frequency desired (depending on budget). Other predictors, like proportion of tests positive, depend on the behavior of thousands or millions of people–getting a COVID-19 test. WW surveillance is touted as easier and cheaper; I’ll buy that.

A big operational question is my mind is using the predictions for “staffing and response planning.” Hospitals are stretched very thin. Most have oodles of open positions that they are recruiting furiously every day to fill. The idea that they could somehow quickly and temporarily ramp up staff or facilities because of a predicted uptick in COVID-19 admissions I think is mistaken. If they could do that, they’d be doing it already, regardless of the predictions of any model.

Perhaps more pertinent for this discussion board, I think there are also some interesting statistical issues. I’ve been communicating with the author about a few of them. Besides the three I alluded to in my initial post:

  1. Three aliquots are taken from each incoming bottle of WW (one bottle per treatment plant, at intervals varying by geographic region; weekly in my neck of the woods). Each aliquot undergoes the PCR procedure. All three aliquots from a given bottle are assayed together–same plate, same technician, same pass through the machine. The result is three readings of SARS-CoV-2 RNA concentration and three readings of a fecal bacteriophage RNA concentration. This is somehow converted to a single measure of “intensity”: log(SARS-CoV-2)/log(phage) for that bottle. It remains unclear to me how exactly the three values are combined into one. They might be averaged, but perhaps with zeros excluded or handled differently. What are implications of using an average of N measurements of some quantity as a predictor to model something else? That average is itself an estimate of the “true” value, with some uncertainty around it, no? How is that uncertainty captured?

  2. At any rate, the analyst receives the above Intensity measure. If the copy number is considered not quantifiable (> 0 but <= 5), the value of 3 is imputed. That’s troubling.

1 Like

Minor technical note: any time multiple measurements are averaged and one of the components can be censored, it’s better not to sum them but to analyze the raw data, treating a subset of the raw observations at censored. The summing can be done on parameter estimates if needed.

Oh, not minor at all Frank, and I appreciate you pointing that out. There are a number of issues here that I am still trying to get my head around. In situations like this (common in bench science) would it be worth fitting a hierarchical model, with aliquot nested within sample? Or is that only if one is interested in the variability inherent in the assay?

With this particular article/study, I worry there is a lot going on, much of it loosely documented, between what the machine displays and the data that the analyst is given to model.

I think this is at least in part related to the notion of replication vs pseudoreplication? Seems like an important concept to understand, and I’m still working on that. I found this explanation interesting:

Yes this seems like a place for a hierarchical model.

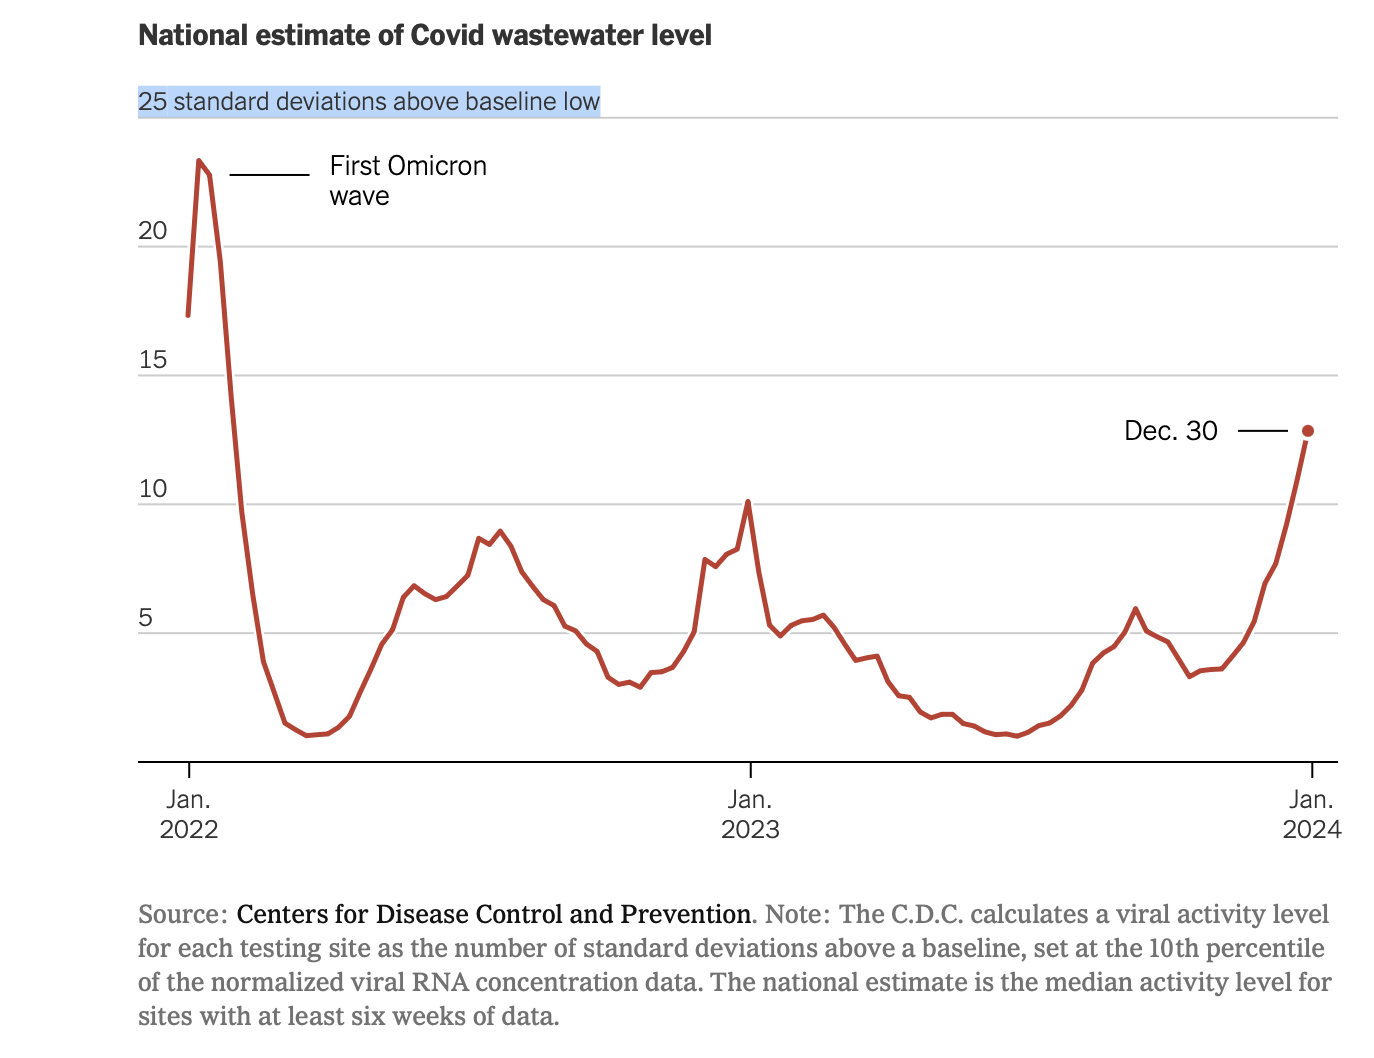
This chart from The New York Times free link caught my eye. The x-axis is time and the y-axis is the number of standard deviations above a baseline low, defined as the 10th percentile. The purpose is to estimate trends in COVID-19 prevalence based on wastewater sampling.

This appears to be a different approach than the cited paper.

I am a dilettante. My interest in applied statistics is exceeded only by my fear of appearing ridiculous. So, before sharing my incredulous reaction (“it’s cargo cult science”), your reactions would be helpful.

Following links from the CDC’s most helpful page I’m also bothered by

  • Presence of viral RNA is established from three positive droplets measured by RT-qPCR or one when multiple assays or multiple PCR replicates are run. This seems skimpy.
  • Normalization may be based on estimates of the served population. From past personal domain knowledge utilities did not collect information at the household level.
  • A minimum of only 3 data points is required for trend estimation.
  • Trends are identified by the slope of the linear regression, which ignores time series autocorrelation issues in regressing observations of log transformed SARS-CoV-2 normalized concentration against “date”
  • Observations showing no virus are recorded as half the detection level.

This is even before aggregating results based on median values.

The methodology doesn’t pass my laugh test. Honestly, though, I’d rather be wrong than think that anyone is making public health decisions based on the results.

Am I being that guy who ______ ?


I’ve posted a longer take here .

The short short is that it is bitter to reflect on the public debate on the science during the pandemic when so much hostility was directed at the public health establishment for fake science that so many deaths ensued as a result of ignoring scientifically informed public health. Even though it appears that some of the initial advice was based on unexamined conventional wisdom discounting aerosol transmission, evidence and analysis is how science progresses.

There are also noble failures that chased down plausible lines of inquiry and learned little useful. Those, too, can be forgiven if anything at all can be salvaged from the wreckage.

Sewergate is the hardest pill to swallow. I read it as an example of Feynman’s Cargo Cult Science, at least as it is described on the CDC sources that I found. It would serve as a powerful, we told you so, you can’t trust government science bloody shirt. Taken on its face, the existence of a facially deficient analysis such as this has far more potential for harm arising from discrediting science-informed policy making than it could possibly be offset by the tea-reading it offers.

1 Like