Unfortunately I have no formal statistical training and my background consists of a few online courses on R and constant googling for answers on stack. So I have a bit of a mess of statistical concepts in my head that I don`t know how to correctly apply sometimes. But this interest of mine has led me to a “local” popularity of answering statistical questions and doing primitive statistical analysis from time to time for my fellow colleagues in my country of residency. I understand that my whole question will look like baby`s babble on Datamethods but I would be grateful if someone could help me put everything in it`s right place.
So I`ve been given a retrospective dataset on 293 hospitalised patients with COVID19 with around 40 categorical mostly binary variables and 20 numerical variables with info on day of the start of symptoms, day of admission and day of outcome. Unfortunately the dataset was collected retrospectively with no prior thought on the statistical or clinical hypothesis and the question posed to me is rather vague. To put it more concisely I am asked to find out whether there are any particular “clinical phenotypes” in this dataset. The only paper close to the subject on COVID19 I managed to find is this one on cluster analysis using PCAs from quantative variables.
I am aware that clustering algorithms pose the danger of finding clusters that may be clinically irrelevant. One such paper was published not so long ago in Lancet on the subtypes of adult-onset diabetes. https://www.thelancet.com/journals/landia/article/PIIS2213-8587(18)30051-2/fulltext
I learnt about the paper from professor Harrell`s blog post on the subject.
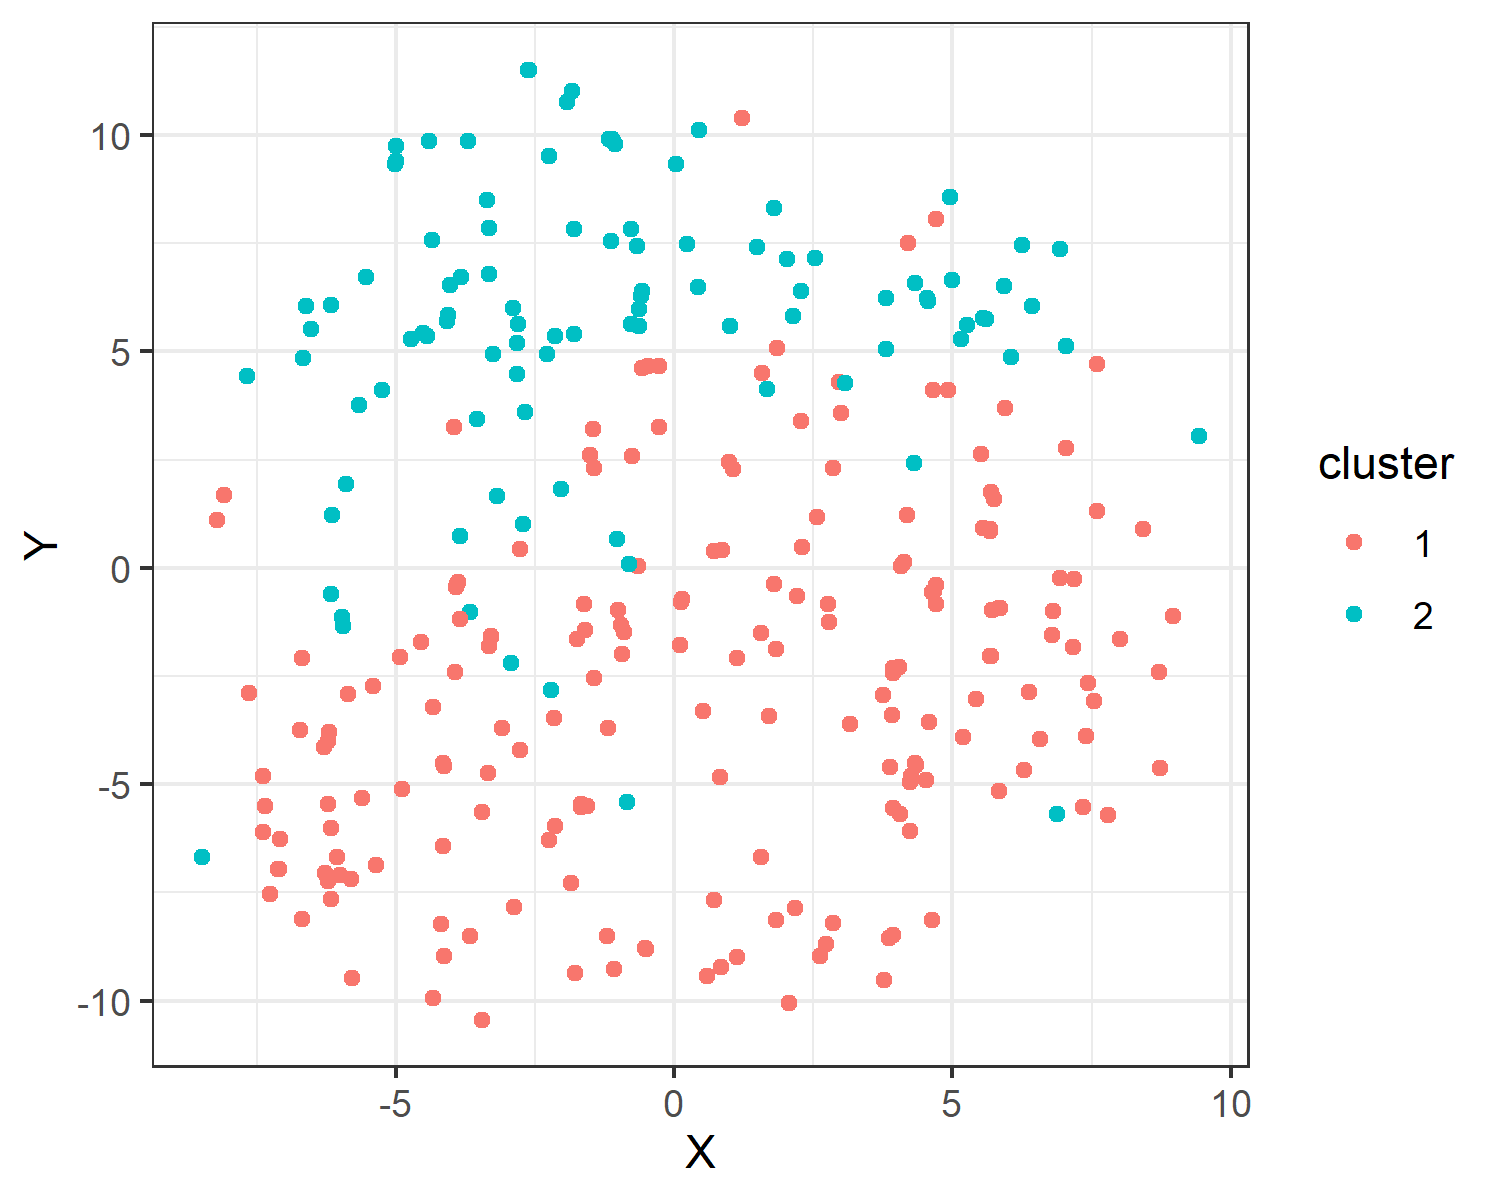
Still I decided to go for this little endeavor of mine to find the mythical “phenotypes” I`ve been asked for. I found that an appropriate (if one can say so) method for mixed datasets both with categorical and numerical variables is to compute a distance matrix using Gower distance. I learnt from the article below (with all the R code) that this matrix can be used for clustering using partitioning around medoids https://towardsdatascience.com/clustering-on-mixed-type-data-8bbd0a2569c3
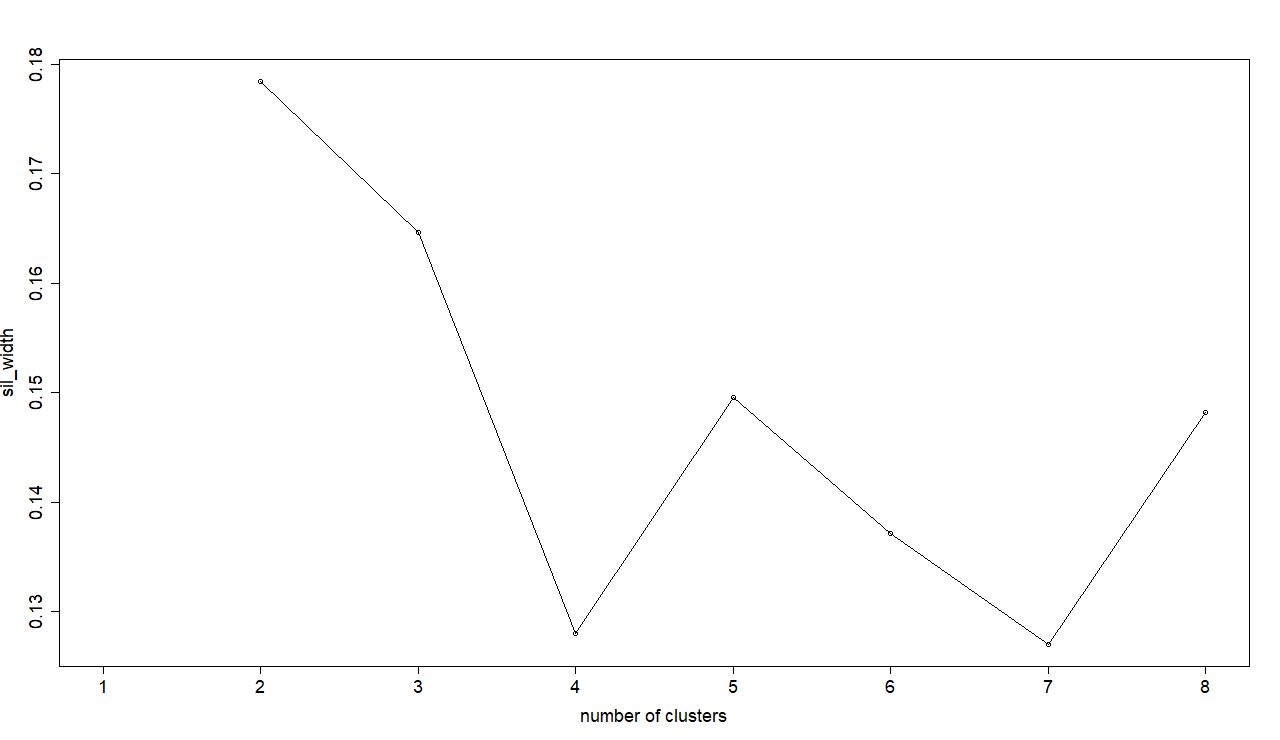
Using the width of the silhouette I decided to go for 2 clusters in my dataset
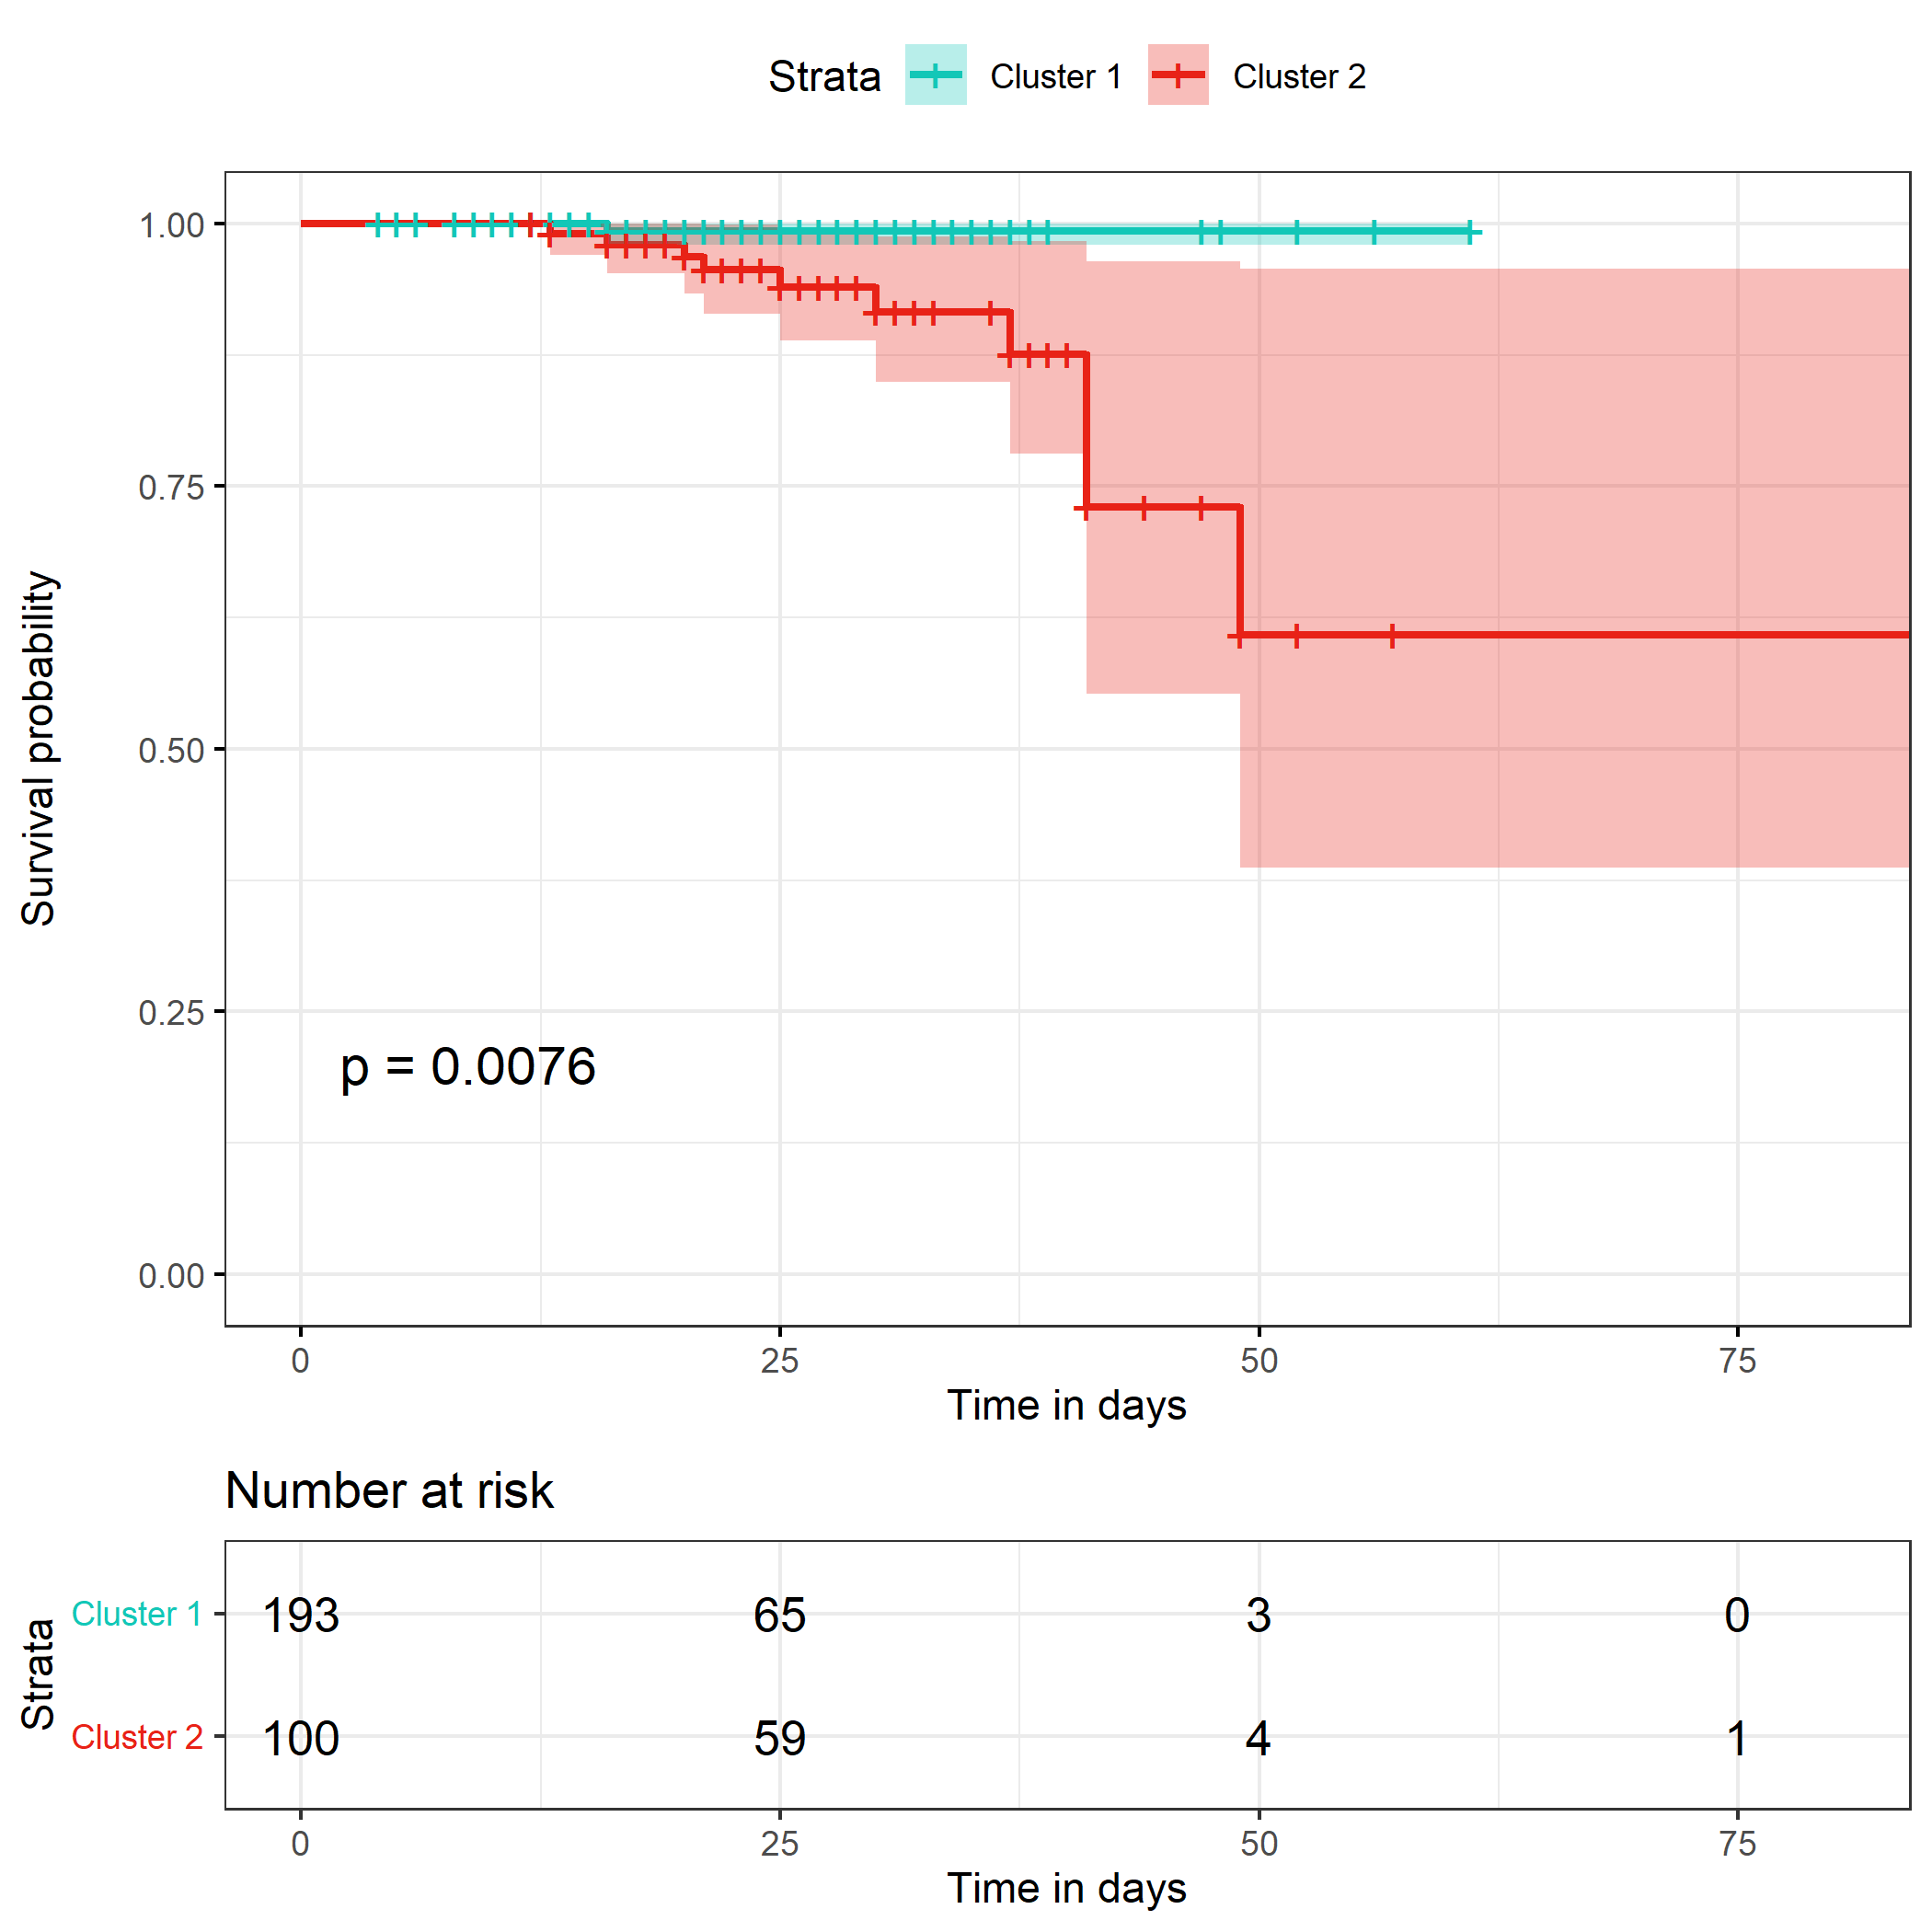
I thought that the practical significance of such clustering may be decided with survival analysis, so I made survival curves using Kaplan-Meier method and fitted a Cox proportional hazards model stratified by the clusters found.
This is the Kaplan-Meier curve I got with the logrank test result
n= 293, number of events= 11

      `coef exp(coef) se(coef)  z   Pr(>|z|)`
cluster_gow2 2.312 10.094 1.058 2.185 0.0289 *
`exp(coef) exp(-coef) lower.95 upper.95`
cluster_gow22 10.09 0.09906 1.269 80.29
Concordance= 0.701 (se = 0.078 )
Likelihood ratio test= 8.23 on 1 df, p=0.004
Wald test = 4.78 on 1 df, p=0.03
Score (logrank) test = 7.08 on 1 df, p=0.008
I`m merely trying to get into the head of a statistician. Is it sensible to dichotomize patients based on a plethora of variables? Does the seeming difference in survival mean that the clusters are meaningful? Or is it a result of some shifting bias of the algorithm? I understand now that although there is an apparent difference in survival I can say nothing on the definite variables that influenced the outcome the most. I now have to run a logistic regression on artificial clusters as my binary outcome variable if I want to know the predictor variables. This now all seems as an added complexity as I could have just tried to fit a multivariate Cox proportional hazards model controlling for covariates at the same time. What would be a more professional approach from the beginning?
My question`s scope is very general but nonetheless I`d like to further discuss appropriate cases of cluster analysis that would be clinically relevant maybe with published examples.
Very nice work! You are right Anton to question the meaningfulness of such clusters. I believe that as in the diabetes example many patient clustering exercises are finding statistical clusters that are not very clinically meaningful. But the most direct problem with observation clustering (as opposed to variable clustering) is that the clusters contain tremendous patient heterogeneity. Heterogeneous clusters can’t mean very much clinically. I believe that investigators have fallen into the trap of trying to “place” patients into clusters instead of using what clusters are really able to provide: centroids and distance of individual patients from centroids. If there are 6 clusters you need to quantify for each patient the 6 distances from cluster centers. That way, and only that way, will you recognize that a patient may be closer to another patient in another cluster than to the center of her “own” cluster.
But I think that variable clustering is far better, and is more interpretable. Create summary indexes based on co-expressed features and quantify a number of non-overlapping dimensions of the problem. Telling how much peripheral vascular disease a patient has tells one more than where a patient is on multidimensional space.
Thank you, professor Harrell!
I’ll be sure to look into the variable clustering. Is there any particular R package you would recommend to use? maybe any additional reading on the subject?
Could you possible elaborate if there any “standardised” solutions of presenting a summary coefficient of some sort how close the patients are to their “own” and other clusters? Any R solution or function?
For variable clustering start with the varclus function in the R Hmisc package, and see the RMS course notes for more information. For observation clustering there are standard distance measures and software but I don’t have any examples handy.
Fisher’s famous comment about statistical post-mortems applies equally to the epistemology of this type of activity. Here is Frank with a perspective on the underlying psychology: https://twitter.com/f2harrell/status/929372580498288641
Thus, your duty is to encourage more genuinely scientific thinking among your colleagues. I wonder if one way to do this is to render the underlying analysis in a more visually accessible way, to discourage magical thinking about what pure statistical technique can accomplish. I have found that correspondence analysis (CA) can encourage domain experts to set forth meaningful categories that might be correlated. (Note how CA has a natural cognate in the clinical concept of a ‘syndrome’.) There are a couple of good R packages for CA; FactoMineR includes an MCA function for multiple correspondence analysis.
i agree but empathise - the example described is very reminiscent of life for a statistician in a university hospital. Maybe id take it as an opportunity to contrast different approaches, have some fun, and promote scepticism and discussion, as you suggest.
I’ve been meaning to learn more about correspondence analysis for a long time. And I need to learn more about hybrid methods that handle mixtures of continuous and categorical variables.
Thank you, David! Your suggestions are great! Your links have led me down the rabbit hole of statistical misconceptions. David Friedman’s text is straight to the point indeed - I ought to read his books on stats now.
I had already tried FactoMineR capabilities of multifactorial analysis (MFA) on this dataset. Unlike MCA it incorporates not only categorical but also continuous variables. But the visual output although handy seemed somewhat out of my grasp. It hasn’t struck me that one can view the visual relationship on the graph as “syndromes”.
Although I wonder how far is the idea of analysing a multidimensional data on a 2D graph from pure cluster analysis? Is it the fact that one who has no intention of drawing strong statistical inferences would just stop at MCA or MFA as a way of describing things as they are (although not without certain amount of subjective interpretation) and not try to fit the data clusters into any particular hypothesis?
I do feel that I should at least try to change the way stats is perceived but I do not always see myself qualified enough as many statistical concepts seem difficult to grasp for me too. Stats as a subject was almost entirely ripped out of the education of most medical students here in Russia. The consequences are frustrating at times. I hope someday I’ll be in the position to change our local status quo.
I’d say the key difference is that MCA provokes effort on the investigators’ part, to posit meaningful categories. By contrast, fully automated methods just let off-the-shelf ‘ML’ algorithms work their ‘magic’ on the data. (Compare Freedman’s complaint about merely “modeling the data”, and his observation that “there is seldom much real difference between the inputs and the outputs”.)
In a way, the positing of categories is similar to the ex ante work of crafting the RHS of a regression equation (vs stepwise variable selection!) or thoughtfully considering the priors of a Bayesian model. Healthier methods insist on more substantive inputs.
@pbstark and @Sander knew Freedman, and could comment more specifically on the full subtext. But I read remarks like these as ‘Popperian’. In Friedman’s “brilliantly original” and “intellectual creativity of high order” I read an insistence that the essence of science is what Popper called “marvelously imaginative and bold conjectures” [below]. Without originality, creativity, imagination, you just get so many fancified versions of the beleaguered grad student who has “collected the data” and now just needs to “run it through SPSS.”
The Freedman article is great David! Thanks. Fascinating to read the history of how planetary relationships/motion came to be understood over hundreds of years. Seems like the process could be summarized as:
WELL-DEFINED QUESTION (e.g., how do the planets move?) THINK OBSERVE/MAKE MEASUREMENTS (WITH INTENTIONALITY) THINK AGAIN PROPOSE A THEORY PERFORM EXPERIMENT TO TEST THEORY RESULT DOESN’T SUPPORT THEORY consider reasons, including error(s) in one or more preceding steps) START AGAIN, this time with better thinking/measurement….
Of course, the “thinking” stages are the key. Historically, answers to big questions often seem to have been found by geniuses who became obsessed with a question and devoted their lives to finding answers. And since geniuses are pretty rare, big leaps in scientific understanding don’t happen every day…
Regarding the original post above, does the question being asked (“Look at this data we’ve collected and see if you can identify COVID”phenotypes.””) follow the usual process of successful scientific discovery? Arguably, the answer is “no,” since the process would be starting at the fourth stage after omitting the first two stages and passing through a warped version of the third stage. It would involve trying to make sense of observations collected without prior hypothesizing or a sense of clear purpose…
In order to have the best chance of answering important questions, don’t we need to have some idea of what might be important to measure/observe BEFORE we start measuring/observing? In other words, haven’t most major scientific advances started, historically, with a very bright person who had the seed of an idea, then figured out a way to collect observations that might lend support to his/her idea (a process that, in turn, hinged on meticulous, reliable measurement), then carefully analyzed the collected data before proposing a theory that could be tested in a reliable way (technology permitting)? So although serendipitous observation has certainly played a role in major discoveries (e.g., somebody bright observing something unexpected and then doggedly trying to explain the outlier), is this usually the way science advances? Has science, over time, developed a misplaced (lazy) faith in the potential of serendipitous observation to answer its big questions?
You have done a lot of excellent work on the basis of the sort of heartsink problem that we all face : data in search of a hypothesis.
Can I suggest that to be clinically useful, you need to approach it from the other end. Instead of trying to precipitate out clusters that may or may not have any clinical meaning or be homogenous enough to be clinically recognisable, why not go about it the other way around and start with clinically meaningful endpoints. Who needs ventilation? Who dies? These make sense as clinical questions, and are worth answering.
By the way, perhaps to the horror of the R community here gathered, have you tried Orange? A very useful way of what-iffing your way through data like this.
Thank you, Ronan!
I had similar questions revolving in my head when I saw the dataset. I set them aside for the fear of generating multiple hypothesis without adequate power to reject them. But I reckon I could choose several meaningful endpoints and try to fit them into a regression model of some sort.
I haven’t tried Orange. Thank you for the suggestion!
Through pain I actually got quite used to R. I like the feeling of control and strong community support. A long time ago I had an unsuccessful experience with another data mining tool that gave output I wasn’t able to interpret. But I’ll try Orange and see what it can do. Maybe it’ll help me choose the hypothesis to test further in R
I had, of course, another thought during the night. Align your model building not to the data you have available but to the data clinicians have available. You can see that some data are available instantly – the patient’s age, sex, BP, sats, BMI etc. Some variables represent data that takes time to arrive, either because of waiting for labs and scans or because it represents the trajectory of a clinical parameter. Beware of any variable with lots of missing values. This can mean that the data are not available routinely, so any model that relied on them would require changes to clinical protocol.
The most useful models are the ones that use readily available clinical data, or that can be done with no specialised equipment – like the 40 steps test : can you walk 40 steps at your normal pace without feeling unusually out of breath? is an excellent test of low sats, and you can do it over the phone.
The other idea I had was to use fast and frugral trees. Gerd Gigerenzer has a wonderful paper called homo heuristicus in which he talks about the problem with theistic cultures. In the common belief system, there is a god who is omniscient and omnipotent. So when constructing decision models, we aim for the god model that uses all the data you can possibly gather and can be really complex to calculate, because we have infinite time and resources.
Of course, we haven’t. We need heuristic models that operate sequentially on the data, splitting it with the single most informative variable at the time. Gigerenzer points out that such models, far from being inferior to multivariate equations, have superior generalisability, require far less data and take into account the temporal sequence of clinical decision making. Well worth thinking about!
The paper, incidentally, is brilliantly amusing as well as thought provoking! Download it here.
Thank you for the heads-up paper, Ronan!
I’ve just finished reading it. It really is an amazing piece of thought. I’m surprised how entangled statistical models, cognitive science and evolution are. I hope it’ll help me choose predictors in my models more intelligently.
I think that the key factor in choosing predictors is to talk to the people who do the prediction! When we were making the SCORE riskchart, I spent three years meeting regularly with the European Society and Federation of Cardiology task force, so that the whole approach to risk estimation would mesh with their guidelines on cardiovascular disease prevention and they, in turn, would be able to integrate the approach as a foundation of their clinical guidelines. Indeed, one of the key victories that we (the epi/biostats people) won was that they recognised that the same risk factors drove cerebrovascular disease as well as cardiovascular disease, so the risk function ended up being a risk function for heart disease and stroke. So the process didn’t just inform the way we were modelling risk, but the way the ESC taskforce was thinking about prevention.
incredible numbers of prediction models are developed and most just gather dust in the form of citations without ever being used in real life. I think that the close and extended dialogue between the model builders and the model users was the key to the success of the SCORE project.