Repeated exposure measures, single (cross-sectional) outcome measure

First of all, a big thank you to @f2harrell and @Drew_Levy for the wonderful 4-days RMS course! I have learned so much and am now even more determined to do my part in lessening the replication crisis in my field of research.

I would love recommendations on the modeling strategies. My data has:

  • A continuous outcome Y, a blood biomarker, measured once at age 25.
  • The exposures are repeated measures of a Likert scale that measure stress, measured annually from age 9 to age 19. I’m starting with modeling this as a continuous variable because of the choice of the models that I listed below.
  • N is roughly 1000. Missing data pattern is unusually good for a longitudinal dataset with very small % of attrition.

I have two main research questions:

  1. Is the exposure across time (cumulative life-time effect) associated with the outcome measured once at age 25?
  2. Can we include an interaction term in the model to account for effect modifiers?

And maybe a bonus question:
3. Can I model my repeated exposures as ordered cumulative predictors as described by Bürkner, P. C. and Charpentier, E. (2018). or not? 10.31234/osf.io/9qkhj

To study these research questions, my initial literature reviews found the following strategies:

  1. Unsupervised data reduction with PCA/clustering and use of the PCs/cluster assignments in an OLS linear regression. I think that this method makes sense and is simple. The downside is the usual choice of how many PCs, or the number of clusters to choose from and how well would this work for repeated exposure over time. I can test this in a simulation.
  2. The latency models for protracted exposures by David B. Richardson at 10.1097/EDE.0b013e318194646d. This models the exposure over time as an integral of the time-weighted exposures as a term in a linear regression model.
    Screenshot 2022-05-20 092224
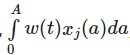
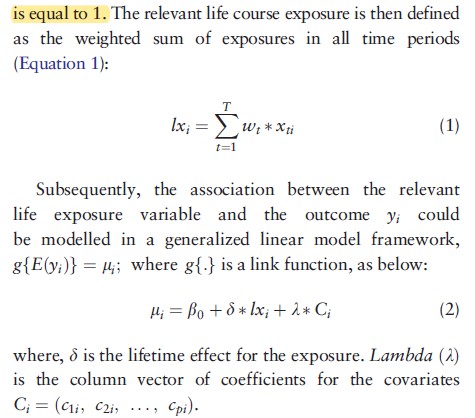
    The pdf of a log-normal distribution or splines can be used to estimate the weights (w) parameters if certain assumptions about the form of the exposure overtime are made (strong intial influence then dropping off overtime).
  3. The Bayesian relevant life course model by Sreenath Madathil 10.1093/ije/dyy107. This model is conceptually similar to the latency model.
    Screenshot 2022-05-20 093157.

I’m thinking of using the latency model for my data. But I was wondering if anyone is experienced with this kind of analysis and has any suggestions and recommendations?

1 Like

Hung, Thank you for your kind words; for your sense of mission to do informative and reproducible research; and moreover for your active participation at RMS 2022.

@f2harrell would have a more authoritative answer than I. But I will give you my impression and inclination.

For a continuous Y, you would have learned from @f2harrell in RMS 2022 about the advantages of the cumulative probability models (CPM) family of models, freeing you from most of the assumptions required for normality and linearity in the conventional linear model (OLS). I would consider modeling the response with a CPM.

For ten repeated measures of stress, I imagine that a time effect is an important factor and that not all of the 10 stress measures will have the same effect on Y. Presumably you have a biological, physiological, or scientific model (a structural causal model: “SCM”) for how stress leads to the biomarker measure outcome; and ideally this should be reflected in your analysis design and statistical model. This scientific model --which can be expressed as a SCM (perhaps a DAG; perhaps a simultaneous equations model (SEM; ) —should be used to strengthen your analysis and inference.

This SCM would–in theory–indicate what kind of induction period or attenuation of the exposure is expected based on subject matter understanding. An expression of the exposure should describe in an explicit and intuitive way how the exposure is related to the response based on your understanding of the scientific processes involved. The repeated measures of exposure might be integrated in a convolution (Convolution - Wikipedia) in which the exposure window, the lag structure, and weighting of each the individual repeated measures as a function of time or lag can be specified. This is a function describing how you think the exposure is operating on the response. And this should be a clear declaration of your scientific model to be evaluated by the data.

I have seen @davidcnorrismd program a convolution function for integrating repeated exposure measures and he might provide guidance.

The question #2–‘can we include and interaction term in the model to account for effect modifiers’–is not really a research question; but is a methodologic and modeling question. Frank has discussed in RMS how testing and fishing for interactions is unwise. If you believe, based on subject matter understanding that the effect of exposure is modified or conditioned in some way by another variable then that should be incorporated in the the model specification and in your analysis. The SCM might incorporate that expectation. There is a literature on how this might be done ( Weinberg CR. Can DAGs clarify effect modification?. Epidemiology . 2007;18(5):569-572. doi:10.1097/EDE.0b013e318126c11d; and Anton Nilsson, Carl Bonander, Ulf Strömberg, Jonas Björk, A directed acyclic graph for interactions, International Journal of Epidemiology, Volume 50, Issue 2, April 2021, Pages 613–619, https://doi.org/10.1093/ije/dyaa211).

You will want to use the SCM to rule out ancillary variables as colliders and and make sure no back door paths are introduced in the conditioning you are entertaining.

I hope this provides some useful perspective on options for your approach to your research.

3 Likes

I apologize for reviving an old thread.
I meet a similar situation (multiple measurements of exposure and a single outcome, both continuous values). I’m still learning and find it challenging to understand these theories. Could you please let me know if the rms package or anywhere else has R examples for this type of research? Thank you.

How many outcome observations are there per patient? If only one you can use standard univariate modeling.

1 Like

Thank you for your prompt and helpful response.

In my situation, about 1,000 people were continuously investigated for seven years, undergoing annual blood checks (with 90% participating in at least five checks). Brain MRI measurements were taken in the sixth and seventh years, focusing on hippocampal volume as the variable of interest.

That is, exposure was measured five to seven times, while outcomes were measured twice (some people only once).

This is an observational study, so confounding factors need to be adjusted for. This is my first time conducting such research. I was advised to conduct a trajectory analysis, observing biomarker changes during the study period and their correlation with the final hippocampal volume measurement. However, I remember you don’t recommend trajectory analysis. I came here to see if anyone has experience with a similar situation and found this post.

Can you give me more suggestions? Thank you very much.

1 Like

Hi Jiali,

You can skip to the bottom for my TLDR advice.

Your situation is difficult, but unfortunately common. My experience tells me that the immediate problem is usually not confounding. To address confounding, you must address the preceding problems first. Mainly what is the research question?

I would first focus on Chapter 3 of BBR. One definition of unconfoundedness is as follows:

Pr(Treat|X, Y(1), Y(0)) = Pr(Treat|X)

In an observational study, Treat is your exposure of interest. X is the set of cofounders, and Y(1), Y(0) are your potential outcomes under treatment == 1 or treatment == 0. In this case, you can answer the clearly defined research question of interest: “What is the unconfounded effect of Treat on Y conditioned on X?”.

In your case, Treat is not defined (you collect many potential exposures in a blood check, over 7 years); Y is not defined (Brain MRI can be many things, i.e., volumes, intensities, a particular structure of interest, 2 time points); and since Treat and Y are not defined, by definition, the set X is not defined. This is why I said the research question is unclear.

Go through the flowcharts in Chapter 3 of BBR linked above. Imagine that after going through it, you arrived at the following:

  1. My treat is some sort of summarization of the annual blood checks. Now I have two new questions:
    • Which marker of the blood checks am I interested in? All of them?
    • How do I handle the longitudinal aspect?
  2. I have decided to parameterize the outcome "brain MRI" as follows:
    • I am interested in the volume of a part of the brain.
    • Since there are only 2 time points, I will build one model for each year.
  3. While my Treat is still unclear, I know that kids and adults have different brain volumes. I also know that age probably affects a lot of the blood measures. So, age is a potential confounder. But still, my set of X is not clearly defined yet.
  4. My goal of the analysis is somewhere between statistical inference and predictive modeling. I think I'm data mining.

This is good progress. As you continue to refine these questions, (i.e., consults with subject matter experts, data visualizations, data reduction), you will eventually arrive at a good, answerable research question. Then, I’ll look at other sections of BBR or RMS as well. For your case, there are many things, but I can see the missing data chapter and the high-dimension data chapter being potentially relevant.

Let’s say that I have decided to define my Treat as an unobserved function of the biomarkers overtime, i.e, g(W) where W = {Cholesterol_y1, Chol_y2, CRP_y1, CRP_y2, etc.}. Then now you have to deal with the choice of g(). I think this is the question that you wanted to ask in the thread. But you can only answer this question if you have the above sorted out first. You have many choices: shrinkage models, trees models, etc. But if you go down this road, you’ll have to simulate the data first and see how good does your chosen g() recover the known effect.

TLDR:
Formulate a clearer research question and look into the literature of epidemiology life course modeling. Good luck.

Hung

2 Likes

Thank you very much, and sorry for the late reply.

The primary motivation for this research is the recent 3D MRI measurements of the brain conducted in the past few years in our institution, which provided overall brain volume and hippocampal volume data. As this examination incurred significant costs, I was requested to try to conduct a research on the results derived from this investigation. I have defined the volume of the hippocampus as the key parameter of interest and am attempting to identify risk factors for memory decline. Blood tests have been conducted to measure various factors. However, I have not yet received the blood data, and I am uncertain about which factors can be merged to the brain data. Currently, I have cardiac ultrasound data, but the cardiac function seems not closely related to hippocampal volume. Therefore, I am considering obtaining blood data. Incidentally, as you mentioned, the relationship between age and hippocampal volume is indeed strong.

Thank you for your detailed and kind suggestions. I will contemplate the research questions based on your suggestions. By the way, do you have any recommended literature about this type of analysis? My statistical knowledge is still insufficient, and I may not be able to comprehend the articles you mentioned earlier. If possible, could you provide me with some practical papers on this type of analysis? I appreciate your assistance greatly.

Hi Jiali,

Unfortunately, I can’t recommend any literature about “this type of analysis.” This is because there is not yet an analysis. You can look into what has been done with similar data for ideas, but keep in mind that your data and interests are likely different.

With such rich data and given your described background, collaborations would be the key to your success. Hence, I suggest the following:

  1. Consult with the biostatistics/neuroscience data analysis department at your institution
  2. Prepare for the consult to make the collaboration, and future iterations efficient and fruitful

Regarding point 1, because the data is very complex, I highly recommend you consult with biostatisticians. There are tricky things an experienced statistician may identify. For example, you said that cardiac ultrasound data is not related to hippocampal volume. However, as a statistician, I know that people’s heart health statistics (HR, SBP, DBP, etc.) change with age. I also know that people’s 3D brain structure also changes with age. If you only look at a bivariate correlation between your cardiac ultrasound data (unclear what this measure is) and brain volume, you might be looking at a pattern that is confounded by age. But if your goal is to build a predictive model of memory loss, you might not even need to worry about confounding at all, but the set of literature that you’ll need to go through would be very different (prognostics research literature). To find biostatisticians, I would start with your PI or your institution’s website. Find the emails of your biostats department and ask them if they provide consultation services.

Regarding point 2, it is best to come to consultations prepared. Right now, I see many unconnected pieces of the puzzle: 3D MRI data, volume of different parts of the brain, memory loss prevention/prediction, blood tests data, cardiac ultrasound data, demographics data, etc. I would start with coming up with a list of research questions that are interesting to you. You can read chapter 2 of “the effect” book here. It contains many good guides to crafting a research question. Then list these questions in order of feasibility, interest, significance, etc., then go to the literature to see the current progress in addressing those research questions. Once you feel like you made some good progress in research questions, biostatisticians can help you refine them and see if they are answerable. Only then, would the type of analysis be decided upon. And most of the time, the biostatisticians would read the literature regarding the involved statistical methods if you don’t have background in biostats.

Sincerely,
Hung

1 Like

Hi Jiaqi

Just a general observation. What you’re being asked to do here sounds like data dredging. You’ve been given a pile of data and asked to “find something interesting.” I understand the impulse to try to make the most out of data that was expensive to collect, but this isn’t the temporal order of research that is destined to generate actionable findings.

As noted by the other responder, research with the best chance of generating actionable results starts with a specific and important clinical question and then looks for specific types of data to answer it. The question should ideally be formulated by subject matter experts, not methodologists. Research that has not followed this temporal sequence very often ends up being extremely frustrating for end-users since everybody looks at the results of the study (which is usually a slew of weak associations unlinked to any solid supporting theory/biology) and ends up saying “now what?”

1 Like

Dear Hung and Smith,
Thank you for your valuable feedback. As you mentioned, there are indeed many shortcomings in my considerations. I am aware of them and am gradually working on modifying my approach. Unfortunately, we do not have a dedicated statistical consulting department, and I handle everything from experimental design to analysis and interpretation on my own. I am trying my best to ensure that there are no errors in each aspect. The book Huang recommended is excellent; I have read a few pages, and I find it very helpful. I will carefully ponder over the research issues. Thank you very much for taking the time to assist me.