I have seen the dozens of posting on the multiple-testing subject. I also have done quite a lot of Stan-based analysis and had to defend these against p-value greedy authors and reviewers. I am also co-signatory of the Nature paper on the subject.
But lets discuss a concrete example of a recent fallback into p-picking:
A medical researcher who always asks for “gold-standard” p-values as a reviewer got a new machine that extracted 43 (yikes!) parameters from each patient’s recording. Some are highly dependent (AUC and maximal value), some are reasonable normally distributed, most are highly skewed or hurdle. The parameters were the outcomes measured on one visit 3 years after two types of surgery. Let’s assume patients were randomized (they were not, but that’s another fight), and no preop-values are available (machine is new, you know )
His question was: What metrics have changed most by surgery? There is no composite hypothesis, the individual metrics were the question (machine vendor wants a selling point, you know). So he asked for non-parametric tests between surgery types, and 4 metrics were “significant” (“please add 1-2-3 asterisks”). I got nervous.
When he decided to pick the 4 significant ones and publish these only, my blood pressure went ballistic, I revised the report and put a p.adjust Hommel on it as a penalty - I did not feel very comfortable, dependencies and so, but my blood pressure went down.
After the gun-smoke had dispersed, I suggested to remove Hommel and ask him to publish all parameters and Lehman-Hodges intervals, leaving the decision to the reader. I remember that 25 years ago Altman asked me to do this in a BMJ manuscript.
Dieter you are fighting the good fight. I think the “crime against data” goes beyond multiplicity adjustment here. I would address it in two ways. First, reverse the problem to get a perfect multiplicity adjustment by predicting surgery type using all of the machine outcomes simultaneously and getting a single likelihood ratio \chi^2 test. Second, use a method that provides a graphic that is exactly what the perpetrator should report: bootstrap confidence intervals of the importance rankings of all of the candidate features. Importance can be either a simple rank correlation measure, or the partial R^2 or partial \chi^2 contributed by each feature in a multivariable model. Examples, with R code, are given in my RMS course notes and in the Challenges of High Dimensional Data chapter of BBR.
Thank, Frank (looks like we are both in Unruhestand - your German wife will translate the pun).
I understand the second step, but the first is a bit unclear:
Predicting surgery: The colleague will like it, because it is easy to understand. But most variables are extremely non-normal, so I believe regression would be invalid. Do ranking and quantile transform, then regression? Or do you have something different in mind?
Good question. Because of the number of parameters involved you may not be able to use spline functions to relax linearity assumptions, so the best compromise may be to transform each continuous variable to achieve approximate symmetry by choosing between no transformation, square root, cube root, or log.
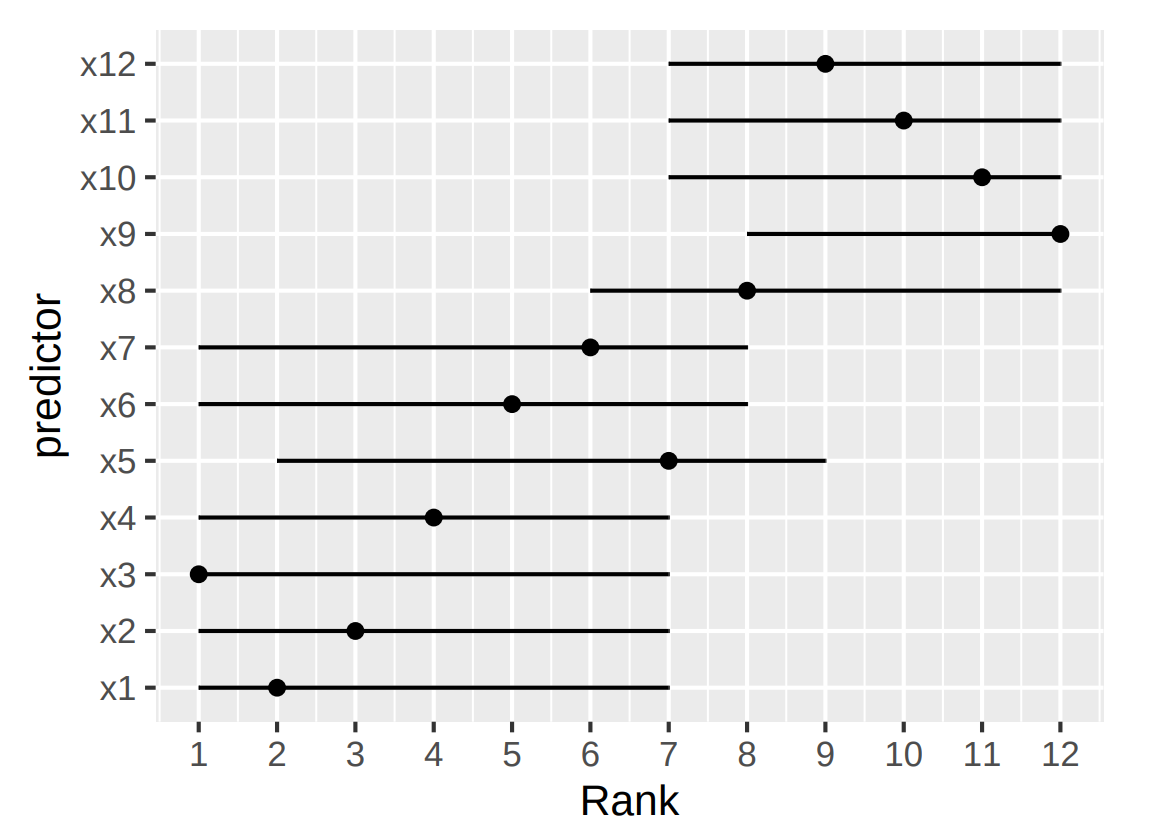
After trying you code, I am confused by your interpretation of the graph. From the way you constructed the data with runifs, I would guess that all variables are created equal and that this show up as an homogenously overlapping smear on the ranking plot. But there are clearly two blocks.
As a critics, I would argue: the method misleadingly creates preference groups from random data. It does not show the unreliability of picking winners, but fakes reliability.
I think the key lies in the last line from that code block. Although x1-x12 are generated equal, their association with Y is not as the simulated magnitude of the association between xn and Y increases from x1 to x12.
Fitting a model to these data, I think you would expect the higher xn variables to rank higher as they explain more of the variance in the outcome.
Maybe you would be interested in the example in this topic where we discussed the same method in the context of evaluating the added value/selection of predictors. I tried it on my own (real) dataset there.
 )
)