Thank you for your advice! I’m going to try this out, but before I start I wanted to make sure I’ve got the details right.
I’m also not particularly fond of blind/automated variable selection, which is also what inspired this project after reading your blog post. We wanted to see if the five routinely measured predictors out of the (over) 20 that are used in various models would suffice and if the others would actually add anything on top of them. But then as I started out I realized this was basically turning into variable selection through added value.
Did I understand correctly that you meant:
- Core + all ‘cheap’
- Core + all ‘expensive’
I was planning to do of a version of this already. For some more details, I have a reasonable idea about the relative costs/availability of the remaining predictors and roughly ordered them based on this and how often they have featured in the existing models:
- Low (additional) cost or even reasonably available, infrequently featured in existing models
- Moderate (additional) cost, frequently featured in existing models
- Moderate or high (additional) cost, infrequently featured in existing models
Beforehand, my plan was to evaluate the added value of each of these sets on top of the core five predictors, mostly to rule out situations where for example five low-cost predictors together provide a decent amount of information but the individual ones don’t. But then I started wondering how to deal with these comparisons once a ‘cheaper’ predictor already provides a lot of information.
For the ranking analysis and the plots of model likelihood ratio X^2, you mean I should use the partial X^2 such as you use for ranking in section 5.4 of your RMS book I think, correct? Assuming so, I produced the plots and attached them here for others who are interested. I color-coded the predictors, black being the core five, blue the low-cost, yellow the medium-cost and red the high-cost ones.
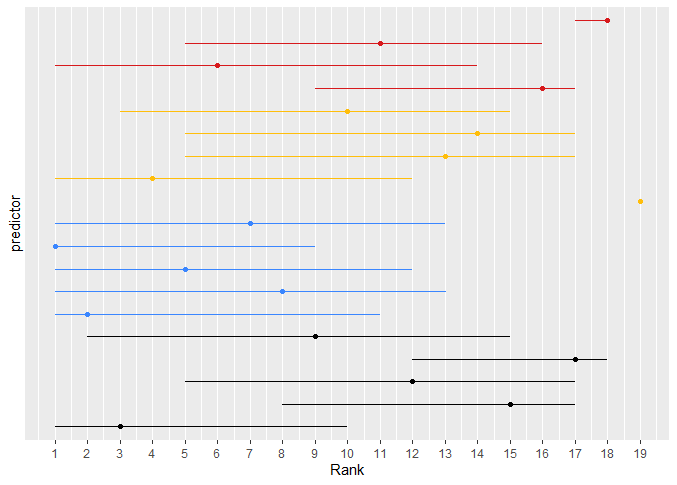
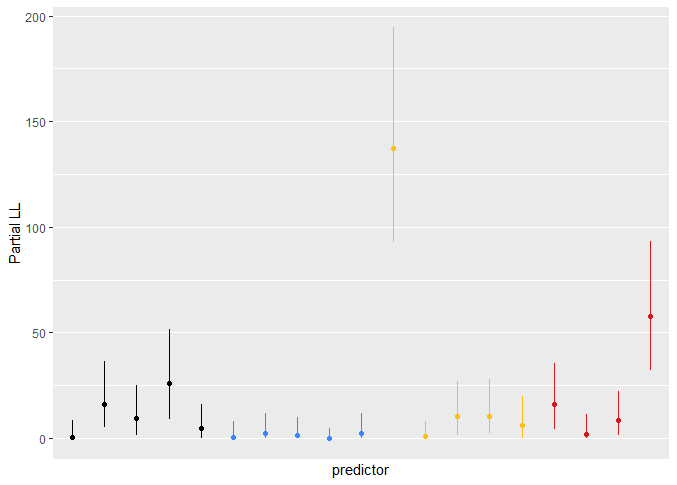
As you discussed for your example in the book, the CIs are very wide. The ‘core’ predictors seem to be somewhat in the middle to upper-middle ranks and also feature a reasonable improvement in -2 log likelihood. The yellow one that consistently ranked high was the one predictor I mentioned in my previous post that resulted in 33% or so added information.