This topic is for discussions about Statistically Efficient Ways to Quantify Added Predictive Value of New Measurements
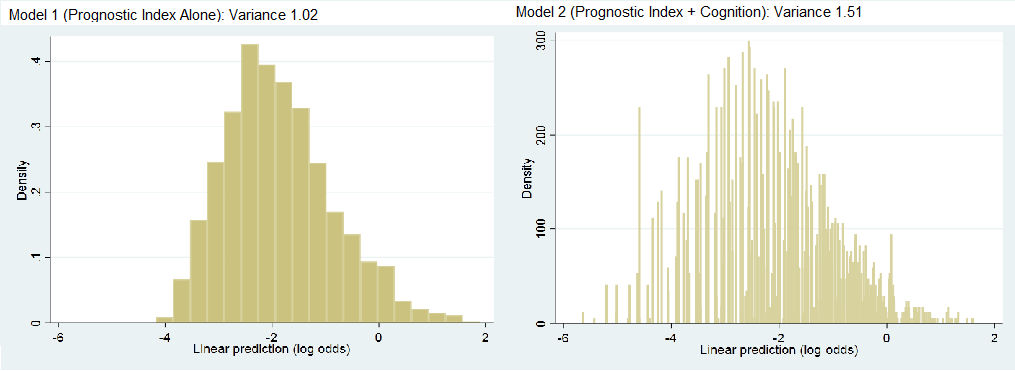
Hi Dr. Harrell, I greatly enjoyed the post. I was hoping to apply one of the metrics to a project I am working on examining whether a measure of cognition adds predictive value to an established mortality prognostic model in older adults. In this project, I calculated the fraction of new information provided to be 0.32 (1 - (1.02/1.51), with histograms shown below.
I was curious how a medical audience might interpret this value - is it just a judgement call if the fraction is high enough? Are there other metrics you would suggest? Any thoughts would be much appreciated.
4 Likes
Great question, Ashwin. If the variable being added was pre-specified, and the base model includes all the usual variables, this is quite a large amount of additional information. I think that a medical audience should be impressed. You might supplement this with a scatterplot of y=predicted value from the combined model vs. x=predicted value from old variables alone. You can compute from this the mean absolute change of predictions, and possible also show a high-resolution histogram of those absolute changes. So this might be a 4-panel plot.
One technical detail. For a binary or ordinal outcome, it is best to compute the variances on the probability scale, and to possibly use that scale in your plots.
2 Likes
Hi Dr. Harrell,
Similar praises as Ashwin for the post. Also, thanks to him for asking a great question.
I am imagining if he were to try to evaluate another measure of cognition (Prognostic Index + Condition_Measure_B). He would then try to compare that model with the model above . . . in other words, non-nested comparison. Are there simple gold-standards for trying to evaluate if Cognition Measure A adds more information for predictions than Cognition Measure B?
I was thinking some possibilities might be . . .
I. There could be clear-cut cases where the LR Test is statistically significant (I know, I know) for the base model vs. Prognostic Index + Measure A but not for the base model vs. Prognostic Index + Measure B
2. Visually comparing their histograms, noting differences in validation indices, etc.
3. Testing in a validation sample
If this IS possible to do, a follow-up blog post for non-nested models would be beyond amazing. Anyway, many thanks in advance.
2 Likes
Hi Kip - Someday I hope to do justice to that question by adding to the blog post. I do get into that in the Maximum Likelihood chapter of my RMS book where I show some decompositions of the likelihood ratio \chi^2 statistic for a grand model, and also discuss the following: Create two models that are nested within the super (grand) model that contains both measures A and B. You get a clear answer with a likelihood ratio \chi^2 test if A adds to B but B does not add to A. If they both add to each other then you have evidence of needing both measurements.
I’d still use some of the indexes discussed in the blog post for informal comparisons of non-nested models.
3 Likes
It might be a silly question… but what to do if I have three candidate markers that I want to investigate?
Let’s call the set of common covariates X, and the three markers A, B and C.
When reading the blog post, my original idea was that we will have three adequacy indices: LR_{X}/LR_{XA}, LR_{X}/LR_{XB} and LR_{X}/LR_{XC}.
However, the book (and especially the paper cited there, Califf et al 1985) suggests otherwise: namely LR_{XA}/LR_{XABC}, LR_{XB}/LR_{XABC} and LR_{XC}/LR_{XABC} if my understanding is correct.
So, I might be totally overlooking something here, but what is the sound approach…?
It all depends on whether you are interested in measuring individual added value of a biomarker, or are interested in having the biomarkers compete not only with X but with each other.
has anyone interacted with climate scientists to see how they go about it? i saw Andy Grieve tweet this article Climate Science Needs Professional Statisticians, so i glanced quickly at their literature: Model Variable Augmentation (MVA) for Diagnostic Assessment of Sensitivity Analysis Results … i want to look into this because it wouldn’t surprise me if medical statisticians and climostatisticians are not swapping ideas, even within medicine there sometimes seems to be limited migration of ideas from one disease area to another
Thanks for the quick answer! Well the question is: “what is the best predictor?”. You might say that in clinical practice you’ll only use one predictor (that’s specifically why you’re interested to know what is the best), so I tend to accept the first interpretation, but in this sense they also compete with each other.
I don’t see the “only use one predictor” as you always need to use background variables such as age. Note that if you are trying to select or rank predictors you should use the bootstrap to get confidence intervals on the ranks as exemplified in my RMS course notes or in the BBR chapter on challenges of high-dimensional data.
Sorry, that was just a typo. I meant only use one additional predictor (i.e., in addition to X, the predictors used in every model).
Hi Prof Harrell,
In my field of medicine, most comparisons of biomarkers are between the AUCs of the predictive models being compared. Is it reasonable to show the p-value calculated using the log rank test rather than the De Long or other value when comparing the AUCs of models?
How can I apply a test such as log rank or De Long when I’m using repeated cross validation of the logistic regression model?
Best,
Stephen
Simply don’t use c-indexes (AUROCs) to compare biomarkers as this can miss important differences because of its insensitivity. Whenever possible use the likelihood ratio \chi^2 test or corresponding Bayesian method using the whole model fit. Here the degrees of freedom will take overfitting into account and cross-validation may not be required.
1 Like
Hi Prof Harrell,
Thanks very much for the reply, very interesting. Are there any biomarker papers you’d recommend as examples of this approach?
It may make it difficult to compare my results with previous papers which used AUC and thus I think I should also provide that metric. Such hypothesis testing doesn’t seem reliable from cross-validated data from what I can find out. This describes an approach for survival data but I’m not sure how to convert to my setting https://www.ncbi.nlm.nih.gov/pmc/articles/PMC3105299/
We can’t keep doing things the same way and expect better results. See the maximum likelihood chapter in my RMS text for an example of comparing two biomarkers using a fully efficient approach. The example is for two competing ways of measuring severity of coronary artery disease. For a more recent paper applying this approach see this.
1 Like
Thank you, is it the coronary artery disease example (section 8.5)?
What’s your opinion on using the partial AUC for assessing the accuracy of a model in a region of high sensitivity/ specificity? Is there an equivalent with maximum likelihood functions?
Yes that’s the section.
Sensitivity and specificity use backwards conditioning, i.e. are not consistent with information flow. Therefore they are not consistent with decision making. Conditioning on the outcome you are trying to predict is not a good idea.
1 Like
Thanks very much for the advice! Very nice of you. I do wonder how much of the biomarker literature is broken, particularly when studies don’t compare prediction with existing clinical variables.
Don’t get me started. The biomarker literature is an embarrassment IMHO.
2 Likes
Dear Prof. Harrell. Thank you very much for this marvellous post/manual. Have you ever tought about to publish this as a review paper? Can these techniques (other than c-index) also be used to compare a new prediction model with an existing prediction model (e.g. in an external validation cohort)?