Regression Modeling Strategies: Causal Inference and Directed Acyclic Graphics
This is for questions and discussion about causal inference related to Regression Modeling Strategies. The purposes of these topics are to introduce key concepts in the chapter and to provide a place for questions, answers, and discussion around the topics presented by Drew Levy.
? Would be helpful for the causal part to go through an example of how a DAG was created and how the DAG informed model fit.: dgl–Good question.
The DAG process might go like this …(before considering what variables are available in the data set available).
Begins well articulated problem statement (harder than you might think); with special attention to precisely what response variable should be;
A literature review and survey of factors considered relevant;
Consultation with subject matter experts (epidemiologists, clinicians, researchers, even patients);
all variables are listed (registered) in Daggity—even those not collected or measured;
Then engaging with the subject matter experts, the relationships between variables (the edges or arcs) are connected—or more importantly decisions made not to connect them because independence is confidently attributed;
Iterating through step 5, a kind of narrative evolves and a consensus—if you can get it—coalesces. This is laborious, tedious, sometimes futile. But the DAG does not need to be perfect or beyond reproach to be useful. It just needs to represent a plausible and generally credible view of the process that give rise to the data;
Daggity (or other software, or calculate by hand) then will supply sets of minimal adjustments necessary for estimating any of several specific types of effects (e.g., total direct effect) of research interest (that you have to specify);
Fortunately, all the variables recommended for adjustment were in the data set. If not the DAG can accommodate unmeasured variables, and sometimes there are other adjustment structures that will work. Other times you do the analysis and acknowledge the possibility of residual bias (that is nothing new–an age old story)
Then these variables (the minimal set of adjustments indicated by the DAG analysis) are put into the model. Continuous variables were allowed to have non-linear shapes with rcs(), and interactions between Tx and important continuous covariates such as baseline were specified—just as FH does in his examples..
The model effects (the functional form of the relationships), graphically expressed with partial plots were shared with stakeholders (inspiring delight and applause ;-); What you learn from the analysis may confirm the DAG or justify a modification to the DAG. Either way, the combination of the DAG and the statistical analysis model help advance understanding and communication about the research problem.
Has anybody estimated the proportion of observational studies published in the last decade that have followed steps 1-10?;
How much stock should intended “end users” of observational research put in the results of studies that don’t follow the process outlined above? For example, should physicians consider the results of such studies to be reliable enough to influence patient care?;
For researchers who adhere rigorously to this 10-step process, how often do they abandon their study proposals at step 8?;
Is it likely that research funders will, in the near future, begin to require proof that the above process will be followed? If the process is not usually followed, what does this say about stewardship of research funds?
That is a BIG question. I am not sanguine about the answer. I will address this some in my presentation about Structural Causal Models & DAGs; referring to the problem addressed by “The multiplicity of analysis strategies jeopardizes replicability: lessons learned across disciplines” Hoffmann 2021; at https://royalsocietypublishing.org/doi/10.1098/rsos.201925.
Thanks. Sorry about the rhetorical flavour of my questions. It feels like “causal” observational research has been churned out at breakneck speed for many years now, with little consideration of its actual impact on intended end users.
I can definitely see the value of using DAGs as a framework to criticize observational research that has already been done. But that’s a backward-looking exercise-much easier than looking forward, using your 10-step approach, to address future important causal medical questions.
The million dollar question is whether clinicians, turned off by so many years of poor quality observational studies, will ever believe that epi studies conducted with causal aims (even ostensibly high quality ones, designed using DAGs and lots of input from external stakeholders), can provide a result that’s sufficiently reliable to guide patient care. As a physician, I have my doubts.
The only way forward, that I can see, to convince clinicians that these newer causal epi methods are sufficiently reliable to guide patient care, would be to design a large number of observational studies using these more modern methods, to compare the results to subsequent large RCTs, and to demonstrate concordance between the findings. But this process will take many years. And in the interim, if only a tiny fraction of “causal epi” studies that are being published even attempt to implement the rigorous 10-step process you describe above, we are flushing away massive sums of research funding that could be put to better use. To this end, journals accepting causal observational research for publication urgently need to raise their standards.
As a clinician myself, I respectfully disagree. It is practically impossible to reliably analyze any data, whether clinical or generated in the lab, without explicitly taking into account the causal networks that may have plausibly generated them. Take for example this paper that has inspired the majority of bench experiments conducted in my lab. The paper does not use the name DAGs, but figure 1A essentially illustrates basic DAG concepts, and figure 2C also shows DAGs.
In the same manner that they guide the design and interpretation of our bench experiments, causal graphs can be used to guide the design and interpretation of clinical trials (figure 2 here) as well as observational analyses (figure 3 here). This is all irrespectively of whether we preregister the DAGs etc. These are useful initiatives but even just simply moving from a “causal salad” state to an explicit representation of our causal assumptions is a major step forward for the analysis of clinical data coming from experiments/trials (whether randomized or not) or observations.
To clarify, I’m not disputing the value of DAGs in understanding and articulating causal relationships. Rather, I’m pointing out that if they are considered the modern “gold standard” for designing causal epi studies, then why are we still not seeing steps 1 through 10 in the original post followed for most published observational research (yours excluded- apologies, I was unable to access the paper)?
If steps 1-10 are not followed, what are readers supposed to do with the results? And who is going to push researchers to adopt this more rigorous approach, if not journals? And even if this more rigorous approach is eventually adopted universally, there will still be the challenge of convincing clinicians to trust the results.
No prob, send me a message and I will email you the paper. A key point is that, orthogonally to the epidemiology considerations, clinicians will benefit from using causal diagrams to understand experiments such as clinical trials. Stay tuned for an upcoming article using such diagrams to interrogate the reliability of surrogate endpoints versus overall survival when interpreting oncology RCTs. The answers become much more intuitive with DAGs.
Ref: Model Selection with Causal Models for Regression Modeling Strategies -----Hospitalization and death among adults with COVID-19 example
In figure 2. U is shown as an unmeasured variable.
My question is that if it is not in the model then how can it be a collider?
May be I missed something.
I believe that the misunderstanding is that it is Hypertension that is the collider: OSA → Hypertension ← U. When Hypertension is adjusted for, it opens a backdoor pathway and U becomes a confounder. It’s a kind of M-bias with hypertension at the center position.
Hypertension can be both a mediator and a collider. Adjusting for Hypertension can both induce conditional independence between OSA and Outcomes (attenuation bias) and, as a collider induce confounding bias, via pathway now involving U which otherwise would have been shielded off.
This suggests an insidious way in which an adjustment may induce additional bias (in addition to the attenuation bias produced by adjusting on Hypertension as a causal intermediate): it may inadvertently open a pathways that were otherwise closed (leading to confounding by U).
It is a theory that may explain the reversal of the unadjusted association: On OR of 1.5 becoming 0.9.
Also, Etminan et al. To Adjust or Not to Adjust: The Role of Different Covariates in Cardiovascular Observational Studies." (Am Heart J. 2021 Jul;237:62-67. doi.org/10.1016/j.ahj.2021.03.008) is a gentle general intro to SCMs for variable selection. There are many others.
Interestingly, there is a response by Judea Pearl to the Ding paper. Pearl says, “While I agree with the analysis, I take exception to the authors’ conclusion that “for linear systems, except in some extreme cases, adjusting for all the pretreatment covariates is in fact a reasonable choice.” My reading of the analysis leads to the conclusion that indiscriminate adjustment is likely to introduce appreciable bias in causal effect estimates.” [emphasis is mine]
Pearl goes on to say, " A more accurate summary would state that “mild deviations from the M -structure tend to increase or decrease the bias produced by conditioning on a collider.” Therefore, researchers should learn to detect M -bias and other bias-producing patterns in their models and decide, on a case by case basis, what covariates need be adjusted for."
I think Pearls comments support the conjecture in my presentation yesterday that arbitrary or data-driven model selection ('kitchen-sink" approaches) contribute to irreproducible results and noise in the literature.
It provides a gentle introduction to DAGs for physicians and uses a few clinical scenarios to illustrate their use in research design.
To summarize (I think): researchers would ideally construct a DAG in the design phase of their study, depicting how different variables can act as potential confounders/colliders/mediators. This DAG would clearly show which variables will need to be adjusted for/“conditioned” on during the analysis phase, and those for which adjustment could introduce bias(?)
Novice question (sorry): How can researchers be confident in depicting the various relationships in their DAG if those relationships were elucidated using previous studies that probably didn’t follow a rigorous DAG construction process? Won’t the final DAG used to design any new study only be as reliable as the studies from which the various DAG relationships were derived?
Good question. There will never be a perfect DAG. Nor a perfect diagram accurately illustrating what is happening inside a cell. The map is not the terrain. Even if the previous studies did not use DAGs, they still contained implicit causal assumptions. This is inevitable for statistical science and science in general. DAGs can be a useful tool to explicitly represent such assumptions.
Note also that in some cases the statistical analysis model will be the same even if the DAG changes. But in other cases readers may find that the pre-specified DAG was not plausible according to their contextual knowledge, and the DAG they find plausible leads to a different analysis model. In that scenario, the new DAG and corresponding analysis can be included as additional material in the manuscript if it is the peer reviewers that want to explore a different causal model. Or (if the primary data are available) readers can do their own analysis after publication.
As an example of the danger of “indiscriminate adjustments”, here in early 2020 they adjusted for a SOFA score and showed that COVID-19 was LESS deadly than the flu. SOFA has 6 variables rendering a single output so the creation of the complex DAG with all those variables (which includes blood gas variables affected by COVID-19) would have given pause.
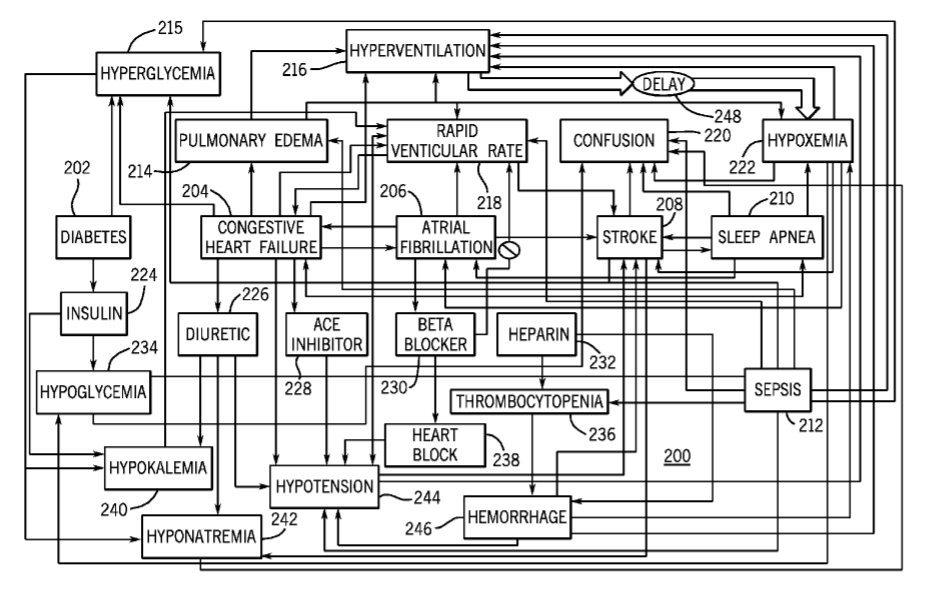
This is VERY important material for critical care research which is struggling under a mountain of non reproducibility. Following up how can this be taught and promulgated. As an example here is a causation graph I published (from 2009).
This is only a fraction of the variables. I see little interest in engaging or even discussing this complexity. Rather studies in this field are consistently performed in a oversimplified way as if this complexity does not exist.