Pavlos’ makes some key points regarding the use of DAGs. DAGs help you define which causal questions can be answered with de data at hand. That’s the first point in Dr. Harrell’s list. This refers to whether the stable-unit-treatment-value assumption (SUTVA) is met. DAGs also help you to design your study. In particular, they help you figure out what variables you need to measure and when, so that a causal effect could be identified. This not only adds to the quality of you study, but could cost-saving. In addition, DAGs help you identify the minimum set of variable you need to condition on to identify a causal effect. This is a great improvement to the dominant approach of including and variables in a model based on statistical criteria or, which in my opinion is unavoidable, based on our conscious or unconscious biases about how our findings should look. I mean, it helps us to play around with the data, until we get what we consciously or unconsciously deem “the right model”. This approach is not only biased, but compromises the validity of statistical tests and confidence intervals. On that regard, DAGS provides a setting for statistical testing that is closer to ideal randomized experiment than any other procedure for variable selection. Moreover, DAGs are explicit and allow for the discussing of findings to proceed in a objective way. In particular, they allow us to make a useful judgement about the role of unmeasured confounders in observational studies. Instead of using the generic argument of “this is an observational study and, therefore, findings could be partially or completely explained by an unmeasured confounder”, which is an argument that does not advances research, we are compelled what confounder that would be and assess whether the claim is possible by adding the counfounder to the DAG. For those reasons, I think that drawing a DAG before designing your study or analyzing your data will contribute to reproducibility. Of course, DAGs take time during the design of the study or the “design” of data analysis. The main problem comes from the need to include in the DAG all variables that are parent (directly or indirectly) of both the exposure and the outcome (measured or not). However, this helps to identify gaps in knowledge, to recognize the limitations of our research, and to make observational studies closer to randomized trials in regards to the identification of causal effects.
This is a great question, and a fair challenge.
I will embark on the thought exercise and dialogue with a few lemma (for our dilemma ;-):
- Nature (and reality) is complex, and Nature is indifferent to what is cognitively convenient for humans.
- Human are ‘obligate abstractors’: abstraction at some level is necessary for our all human functioning—whether we are aware of it (or like it), or not. Otherwise, it’s “turtles, all the way down” (the regress argument in epistemology).
- Scientists always have to make decisions about delineating or circumscribing the boundaries of a problem, and factoring out the operative elements of the system that is the object of their inquiry. Often those decisions involve ambiguity and entail annoying contingency. I am sympathetic that this is both discomforting and discomfiting.
This is all by way of asserting that the annoying fact that it isn’t easy does not contradict the merit of the method proposed. And the fact that we are vexed by complexity does not mean that indiscriminate, arbitrary, or agnostic conditioning are what we have to ‘satisfice’ with.
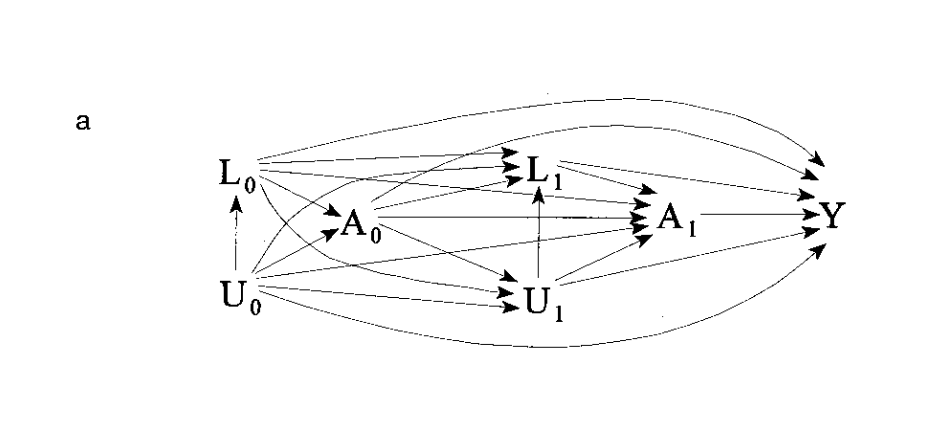
An important thing to recognize and keep in mind in using SCM/cDAGS is that the basic cDAG is useful for static acyclic problems: problems where time and feedbacks are not aspects of the system. Problems like time-dependent confounding require special methods. I suspect that awesome ‘confuse-o-gram’ you provided above (I love it!) is one of those aporia that are best addressed with Marginal Structural Models and all that really fancy stuff; but are not tractable by the ‘bog-standard’ static cDAG.
For instance, in observational studies with treatments that vary over time, standard approaches for adjustment of confounding are biased when there exist time-dependent confounders that are also affected by previous treatment. Estimation and inferential complications arise when there is a time-dependent covariate that is a predictor of the outcome of interest, and also predicts subsequent treatment, and past treatment also predicts subsequent level of the covariate.
The problem expressed in the network diagram you provided above is likely not acyclic; and look to me more like the something appropriate for ‘MSM’s and fancier stuff’. There are methods proposed for handling time-dependent confounding and other complexities of that ilk. But it requires sophistication, specialist support, and lots of work and time: and that just sounds to me like Science.
So my initial and provisional response to your query “what can be done?” is take a deep breath, look at other ways of factoring the problem and look for other statistical tools indicated for the problem: but I would take issue with anyone throwing up their hands and saying it is too complicated and the best we can do is what we have been doing in the past—throwing things in the model until it strains to converge in the interest of getting a result that we can publish, only to grow the “mountain of non reproducibility” further.
I hope this is helpful. I will reflect more on this and hopefully provide a more ‘operationalizable’ response.
A ‘grab-bag’ of guidance to consider:
- Robins, James M.; Hernán, Miguel Ángel; Brumback, Babette. Marginal Structural Models and Causal Inference in Epidemiology, Epidemiology: September 2000 - Volume 11 - Issue 5 - p 550-560.
- Tyler Williamson, Pietro Ravani, Marginal structural models in clinical research: when and how to use them?, Nephrology Dialysis Transplantation, Volume 32, Issue suppl_2, April 2017, Pages ii84–ii90, https://doi.org/10.1093/ndt/gfw341
- Miguel A Hernán, Babette Brumback & James M Robins (2001) Marginal Structural Models to Estimate the Joint Causal Effect of Nonrandomized Treatments, Journal of the American Statistical Association, 96:454, 440-448, DOI: 10.1198/016214501753168154
- VanderWeele, Tyler J. “Marginal Structural Models for the Estimation of Direct and Indirect Effects.” Epidemiology, vol. 20, no. 1, 2009, pp. 18–26.
- Talbot D, Rossi AM, Bacon SL, Atherton J, Lefebvre G. A graphical perspective of marginal structural models: An application for the estimation of the effect of physical activity on blood pressure. Statistical Methods in Medical Research. 2018;27(8):2428-2436. doi:10.1177/0962280216680834
- Hernán MA, McAdams M, McGrath N, Lanoy E, Costagliola D. Observation plans in longitudinal studies with time-varying treatments. Statistical Methods in Medical Research. 2009;18(1):27-52. doi:10.1177/0962280208092345
- Chiba Y, Azuma K, Okumura J. Marginal structural models for estimating effect modification. Ann Epidemiol. 2009 May;19(5):298-303. doi: 10.1016/j.annepidem.2009.01.025. PMID: 19362275.
- Robert W. Platt, Enrique F. Schisterman, Stephen R. Cole, Time-modified Confounding, American Journal of Epidemiology, Volume 170, Issue 6, 15 September 2009, Pages 687–694, https://doi.org/10.1093/aje/kwp175
Thankyou.
What an enjoyable and helpful read, your post.
I recently realized that for the problems I deal with the G methods for longitudinal data that @Drew_Levy mentioned are probably more appropriate. However, the issue is many many clinicians/biomedical researchers are not yet familiar with these methods. I did attempt recently to go down the rabbit hole of MSM/SCMMs and G-comp, and I chose a Bayesian approach on top of that, but I ran into skepticism of the results. First of all, many biomedical researchers want clearcut p-values (despite the problems) and getting these for my model which had plausible interactions I wanted to regularize (hence Bayesian methods) and so on was not straightforward. And I think they are just used to the standard, even if biased, approaches that have worked and been published before.
Causal inference computation methods (outside drawing a DAG to understand the problem) largely right now are seen as more experimental than the vanilla associational based methods that researchers have seen. I fear that the issue is the methods require a significant mathematical background to even approach and on top of that are difficult to communicate to non-statistician/ML people.
I see your frustration. The implications are cause for despair.
First, it is becoming increasingly evident that the ‘standard’ approaches ‘that have worked and been published before’ are not in fact ‘work’-ing’; and being published is a poor measure of veridicality. The merit of much published work may be limited to providing the comfort of familiarity; a p-value (from anything other than a well-conceived, well-designed, well-controlled, well-conducted RCT) telling one only that some inconsistency with an artificial null notion may register in the data.
The attitude you describe (stalwart attachment to the status quo) will be familiar to those acquainted with the history of Science (“And yet it moves” —Galileo; “I know of nothing more terrible than the poor creatures who have learned too much”—Ernst Mach [ironically]).
We get what we pay for; and for good information the price is often dear. There is a design-analysis trade-off: what we elide by not investing up front in design is mortgaged to be paid later (perhaps with usurious compound interest) in complexity of analysis and viscid uncertainty. Uncertainty adds to the cost of forgoing investment in design. The only recourse to the conundrum you describe is greater investment in design, but we’ll have to ‘pony-up’ with time, energy and treasure.
Yes. it is all difficult.
It might be worth exploring IJ Good’s Reverse Bayes approach, that Robert Matthews and Leonhart Held have described as Bayesian Analysis of Credibility. I posted a few re-analyses of studies (that reported frequentist intervals) to derive the Bayesian prior that rendered the report credible with the null, or with the existence of an effect.
This paper mentioned by @AndrewPGrieve is also worth study
I didn’t know quite where to flag this, but this really excellent study, co-authored by Dr.Msaouel (see his posts in this thread), was just published:
I don’t have the training to properly understand the statistical portions of the article, but the overall quality of this piece of observational research stands out like a beacon in the sea of poorly considered, data-dredged (and therefore clinically non-actionable) muck that is today’s medical literature. Causal models are shown in the Supplementary Materials.
This is a perfect example of the colossal effort that that will likely be needed in order for newer causal inference methods to start making an impact in medicine. The research question was clear, important, driven by clinical observation, and supported by strong biologic plausibility. Multiple methods were used to try to establish support for causation. Sadly, such effort seems missing in >99% of research that gets published today. Congratulations to the authors- an example of how things should be done.
Thank you for the kind words. It was this particular challenge of linking renal medullary carcinoma with high-intensity exercise in persons with sickle cell trait that led us into causal diagrams and the do-calculus to guide our analyses.
We were essentially facing a similar dilemma to the one scientists faced in the mid-20th century with smoking and lung cancer: 1) we had a plausible mechanistic hypothesis connecting high-intensity exercise with renal medullary carcinoma in the setting of sickle cell trait; 2) we had animal experiments showing that high-intensity exercise in mice with sickle cell trait would damage the kidneys as predicted by our model; 3) we had observational clinical data but a randomized controlled trial would be impractical and potentially unethical.
Then we looked back in the history of how Ronald Fisher despite his extraordinary causal intuition never accepted the causal relationship between smoking and lung cancer.
And we realized that a key tool that Fisher was missing was a language to explicitly represent and test his causal assumptions. This is what led us into causal diagrams and the corresponding do-calculus mathematical syntax, which then helped us gather the clinical data and interrogate them in a principled way guided by our mechanistic causal assumptions to address the challenge of renal medullary carcinoma pathogenesis.
Before that, my Bayesian training instructed me to condition on everything. But what does that even mean in this case? How do we decide in this hopeless maze of statistical possibilities which variables to even extract? That approach made no sense. On the other hand, causal diagrams were remarkably similar to the approach we use to design lab experiments. They very naturally allowed the integration of our laboratory findings with our clinical observations.
We first did a test run of causal diagrams versus conditioning on everything in our institutional kidney cancer database. The causal diagrams yielded results consistent with established knowledge whereas conditioning on everything produced only noise. This ended up being Figure 3 of our causal diagram review article. Dan and I wrote that review to teach ourselves first. After those results, we knew that the approach would be the right fit for the renal medullary carcinoma analyses.
Thank you for the link to your interesting review about causal diagrams. Regarding Figure 3B, you write in the article that “On the other hand, body mass index (BMI) and age are not confounders, mediators, or colliders, and controlling for these “neutral” variables would neither increase nor reduce bias when estimating the causal effect of RCC histologic subtype on overall survival.” However, if BMI and age are associated with overall survival, wouldn’t you gain a more precise hazard ratio estimate of RCC histologic subtype by including them in the model as well?
Have you elaborated on this claim anywhere, Pavlos? How did John Snow manage to even tie his shoes in the morning?
Good question. Strictly speaking, due to the non-collapsibility of the hazard ratio, these “neutral” variables would increase the power of null hypothesis tests and not the precision. See here also for additional description of the phenomenon in odds ratios. To keep that review simple, we chose to focus only on bias reduction. We do elaborate more on collapsibility and precision in this review that again uses kidney cancer as its motivating example.
If you follow Fisher’s article that I linked to, as well as the whole debate he had with others at the time on smoking and lung cancer you will note that his main arguments are causal. Even genius level causal intuition can be helped by explicit representation of the presumed causal assumptions. We were not Fisher but thankfully we had tools that he did not.
Have you identified specific points in his train of thought where he demonstrably floundered precisely because he lacked access to (e.g.) graphical methods? (Metacausal reasoning may be involved here — causal reasoning about causal reasoning.)
Yes, an easy one is that he did not accept this counterargument which is very easily understood with graphs. Note that we used the same kind of reasoning in our renal medullary carcinoma study (sensitivity analysis and supplementary figure 2).
Thanks! This looks super interesting.
I assume you mean not an effect modifier by “neutral”? Because these measures are noncollapsible, adjustment for a prognostic covariate tends to reduce bias (not so for collapsible binary effect measures) and of course in a large study the bias dominates. I believe however that a study has to be really small for loss of precision to dominate if there is gross heterogeneity of treatment effect across these covariates.
The authors of the odds ratio paper also state that “It should be noted that for large sample sizes the mean square error will be dominated by its bias rather than variance component, so that for sufficiently large samples the adjusted estimator will always be preferable.”
Another fantastic question that merits clarification. A major challenge I sense here again, as has happened in a prior thread, is the different terminologies / notations used between fields. @Sander belongs to the rare breed that can seamlessly connect them but they otherwise remain a great source of misunderstanding.
Fully cognizant that it can be an oversimplification, it helps in this case to adopt Pearl’s demarcation between statistical (associational) concepts such as collapsibility, odds ratios, hazard ratios, regression etc and causal concepts such as confounding, randomization, instrumental variables etc. Our review focused on causal concepts whereas all your questions refer to statistical concepts. Thus, when we say “neutral” we do not refer to statistical effect modification (e.g., a multiplicative interaction in a regression model) but a variable that does not confound (in the causal sense), mediate or serve as a collider for the exposure-outcome relationship of interest. This is described both in our aforementioned review and other references offered both there and in this thread.
The difference in terminologies between statisticians and causal inference methodologists applies to the term “bias” as well, and you are very correct that I should have clarified this. @AndersHuitfeldt excellently elaborated on this distinction in this thread. Your comment on bias follows the statistical definition and the related bias-variance trade-off. I am working on a draft paper where we do, for example, connect the bias-variance trade-off with causal concepts, consistent with the notion that the demarcation between “statistical” and “causal” is far from perfect even though in our particular thread here it helps us maintain focus.
Yes, I agree fully with your observation and indeed I was referring to a completely different concept. I have however been pondering the concept you have defined so I have a question:
Can change in precision with noncollapsible measures really be compared given that the precision comparison is made for different groups of people and thus the estimators are computing estimates of the value of different estimands (conditional and marginal)?
(does not apply to the power issue since the conditional and marginal estimands share the same null).
Another fantastic question. I have alluded in other post in this forum that I indeed agree that the precision comparison is typically complicated for non-collapsible outcomes (it actually may paradoxically show decreased precision for the conditional estimate), whereas the power comparison is straightforward because both the conditional and marginal estimates share the same null hypothesis. See section 1.3 of this excellent article for a more detailed discussion. This is an example where the frequentist approach can provide a simple and elegant solution.
Having said that, I do believe there can be Bayesian solutions here but this is a story for another day.
Responding to ESMD Sep 2021, I think that there are some practical ways forward to increasing confidence in rationale behind DAG relationships. Risk of bias assessments are standard for systematic reviews and meta-analyses, and the same tools can be useful for assessing studies that inform causal diagrams. This link has a full description of my opinion.
I think that Professor Harrell’s steps at the beginning of this thread are useful, highlighting the utility of interdisciplinary collaboration. However, it is important to reflect the source and specifics of rationale when writing up our modeling methods in publications. Clinicians have the benefit of observing patients for outcomes in ways that are not always recorded in research, but part of the rationale for research is to provide insights that are not biased according to non-random selections of patients for individual clinicians, highlighting the importance of research. Particularly younger physicians derive their knowledge from scientific literature, curricula, senior clinicians, guidelines etc. John Ioannidis argues and my experience as a peer review both highlight the need for quality improvement in literature, Richard Smith highlights that older clinicians spend very little time reading it, and local physicians have confirmed his finding. A surgeon told me that he would estimate that 70% of surgeons do not read scientific journals; please validate or refute if anyone else has checked into this.
There are a lot of sources of information, different ones will be available to different researchers, and all are snapshots of reality with limitations. Tools exist for evaluating literature critically, which can also provide ideas for critical thought in discussions with experts. Sensitivity analysis using different sets of independent variables is underused in regression-based research, providing a solution where uncertainty remains about causal diagram structure. And datasets can be merged to fill in gaps where data on variables are missing, described in the Rehfuess et al. paper cited in the link posted above.
Model specification is a vexing challenge, even to Nobel Prize winners, whose papers provide useful insights. James Heckmann wrote a paper in 1999 titled ‘Causal parameters and policy analysis in economics: A twentieth century retrospective’.
I hope these ideas are helpful, that your research is going well, and appreciate any further ideas in addition to those people have posted in this thread already.
This 2005 paper by @Sander_Greenland should be required reading for anyone dealing with analysis of observational data.
Greenland, S. (2005), Multiple-bias modelling for analysis of observational data. Journal of the Royal Statistical Society: Series A (Statistics in Society), 168: 267-306. link
I’d describe it as a case study in Robust Bayesian Analysis.