Should one derive risk difference from the odds ratio?

This paper (Doi et al. 2020) came out last year heavily advocating for the odds ratio (OR).

https://www.jclinepi.com/article/S0895-4356(20)31171-9/fulltext

I am aware of OR’s advantages over risk ratio (RR), but I have heard mixed thoughts regarding how to derive risk difference (RD). For example, this paper from the GRADE group explains derivation from both OR and RR (https://www.jclinepi.com/article/S0895-4356(12)00032-7/abstract). They do not clearly say that one should derive the RD from RR, but neither advocate in favor of OR.

I am performing a Bayesian re-analysis in which my goal is to report both RD and OR/RR. I will use a fixed baseline risk from a control group (r0). I am leaning towards deriving the RD from the OR using “equation 10” from Doi et al. 2020.

However, I haven’t read many discussion about this equation. I would like to hear your thoughts and if you believe this would be the most appropriate way.

Thank you!

6 Likes

In summary, this paper demonstrates that the OR is a likelihood ratio that links the observed odds (of an outcome) under non-exposure to the expected odds under exposure. If the exposure has a consistent effect then this OR is a consistent measure of the effect of an exposure. The RR and RD are just ratios and differences of these odds converted back to risks and for this reason vary as the non-exposure odds or risk vary. There is no logical reason why these were ever construed to be constant measures of effect and indeed to take them as constant or portable is to deny the validity of Bayes theorem. So, in short, the answer is yes, one should only derive RR and RD from the odds ratio and their utility lies only in explaining the results of a study in terms of fold increase in risk or absolute difference in risk for a baseline risk of interest. They are not effect magnitude measures and should not be treated as such in epidemiology.

3 Likes

There is some empirical evidence in favor OR and RR models

Some time ago (2002), Jon Deeks compared effect measures for 551 systematic reviews of trials with binary endpoints, and observed that “the RR and OR models are on average more consistent
than RD (models), there being no dierence on average between RR and OR.” .

The more general conclusion is “it depends”.

DOI: 10.1002/sim.1188

2 Likes

This debate has been going on for decades and no resolution is in sight. My colleagues and I regard Doi et al. as a mistaken exercise in circular reasoning due to basing their analysis on examples in which the OR is assumed constant, confusing mathematical with empirical properties, failing to understand the implications of causal models, and using a method to convert ORs to RRs that has long been known to be biased. Critiques of their paper will be appearing in the J Clin Epidemiol, and will explain their errors in detail.

The putative advantages of ORs are only statistical conveniences which should not over-ride the need for measures that connect directly into clinician and patient concerns. That said, many may find it confusing that one may still prefer and use logistic regression for primary data analysis as long as one keeps the critiques of OR in mind. This means including product terms as needed to allow for variation in the OR, and at the end converting the logistic results to RR estimates using unbiased methods if conversion is necessitated by the the outcome being common in some subgroups (when the outcome is uncommon at all treatment and covariate combinations, the OR will approximate the RR, and so the debate is muted). Additionally, when risk-benefit issues are of concern, provide absolute-risk and RD estimates from the model. Valid methods to do all this are well documented in the literature (Ch. 21 of Modern Epidemiology has many references).

8 Likes

A response is already available but nothing in it that casts much doubt on this issue:

Response to Doi et al

We have also responded to it here:

Rebuttal by Doi et al

So we will see what further critiques come through but given the first response it does not seem like any errors have been flagged thus far by a team comprising of well known epidemiologists and biostatisticians. Both these papers will be out soon in J Clin Epidemiol

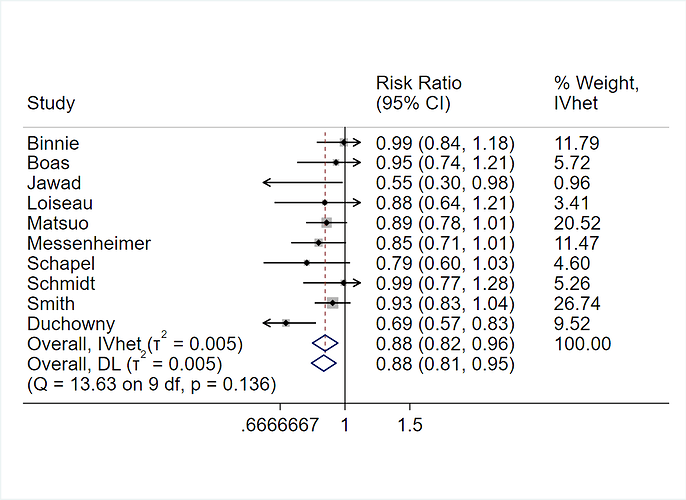
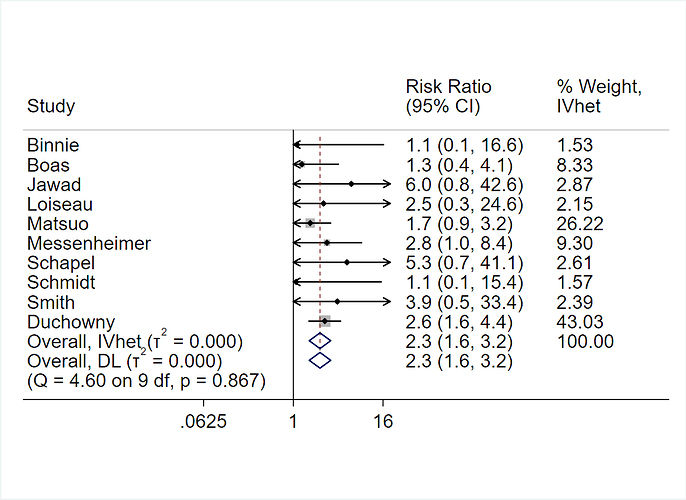
Thanks for sharing the paper by Deeks. It actually goes to support the stand in Doi et al discussed in this thread. If you take the data in Table V in the paper we can plot RR(B) as follows:

and RR(H) as follows:

It is clear now that the emphasis on the P for heterogeneity is not really important given that there is less clinical heterogeneity (in my view spuriously so) with RR(H) despite having a lower P for heterogeneity. What is more important is after switching baseline risk to its higher value, the RR has drifted towards the null as we had pointed out in Doi et al above and whatever differences we get in P for heterogeneity are simply due to the change in statistical properties of the CI. I believe this paper supports our view as opposed to answering the question that it set out to answer.

1 Like

Thought I will respond more specifically to the four points raised by @Sander,

First, I agree with the comment that this debate has been going on for decades - we need a solution. I will take the points out of sequence

Point 1:" using a method to convert ORs to RRs that has long been known to be biased"
The conversion is exact if baseline risk is fixed for obvious reasons. Is there a bias when we convert degrees Celsius to Fahrenheit? This needs more input so we understand the nature of the bias being flagged here. Of note we refer only to conversion of a point estimate.

Point 2: “mistaken exercise in circular reasoning due to basing their analysis on examples in which the OR is assumed constant
I do not see a circular argument here. We did not hold OR constant because we prejudged it to be a measure of effect but because the OR was the only measure not associated with baseline risk. The question we try to answer is that for a given OR does the RR vary across the range of baseline risks possible and the answer was yes. Perhaps you can be more specific as to how this invalidates the non-portability of the RR and RD?

Point 3: “confusing mathematical with empirical properties
This was flagged by your colleagues in their response but the fact that there is numerical equivalence of measures at low baseline risk does not detract from the non-portability of the RR

Point 4: " failing to understand the implications of causal models"
I assume you mean the “non-collapsibility” of ORs means they are not likely to be a parameter of interest in causal inference. My group does not agree that that is the case because our view has always been that to demonstrate this property we need to collapse on risks not on odds - a point I tried to make earlier on this site.

2 Likes

This seemed to be a closely related thread, that should make the points of disagreement clearer:

1 Like

I think this example from Shrier and Pang might help put things in perspective. The question is simple: Does diabetes modify the effect of treatment on mortality? The authors say no, but is that really true?

Dead Alive Total Risk Relative Risk (95%CI) Odds Ratio (95%CI)
All Patients
Treated 130 370 500 26% 0.50 (0.42 to 0.59) 0.32 (0.25 to 0.43)
Control 260 240 500 52%
Total 390 610 1000
Non-Diabetic Patients
Treated 70 280 350 20% 0.50 (0.39 to 0.64) 0.38 (0.26 to 0.53)
Control 140 210 350 40%
Total 210 490 700
Diabetic Patients
Treated 60 90 150 40% 0.50 (0.40 to 0.62) 0.17 (0.10 to 0.29)
Control 120 30 150 80%
Total 180 120 300
2 Likes

Blockquote
Does diabetes modify the effect of treatment on mortality? The authors say no, but is that really true?

I read the article; the authors constructed an example where (by assumption) treatment benefit was independent of disease status, but the naive use of the odds ratio as an effect measure suggested otherwise.

The argument against the odds ratio (AFAICT) is that it overestimates the effect when the outcome of interest is more prevalent in controls.

I don’t see any problems with the logic of their example: caution must be used with OR effect measures. We cannot conclude from an OR based on RCT data that there is any interaction between treatment and a covariate; it could just be a mathematical artifact.

In other articles, Senn and Dr. Harrell have advocated the use of additive scale (such as log OR) as measures of effect, especially for research synthesis/meta-analysis.

This set of slides by Stephen Senn and this paper: Controversies over Randomization also seems relevant (found by looking at Dr. Harrell’s blog posts):

I’m not exactly clear on how one might use this information to improve decision making. Doing a search for “relative risk” on this forum brought up this post:

Blockquote
The first problem stems from trying to replace two numbers with one, i.e., instead of reporting the estimated outcome with treatment A and the estimated outcome with treatment B, the physician just reports the difference between the two.

It seems the problems with naive use of OR as effect measures can be avoided, but clinicians would need to use both absolute and relative measures of effect, but I’m not exactly sure how both numbers are related to a create declarative statement of probability for an individual. I’m going to need to read that blog post more carefully.

Back to the initial post: it seems that the debate is a confusion of 2 worthwhile goals: appropriate reporting and analysis for researchers, and appropriate utilization by clinicians. It seems that researches should do the analysis on the OR, but external context is needed by clinicians for proper appliction.

1 Like

Is there evidence for this? Or is it possible that the RR underestimates the effect when the outcome of interest is more prevalent in controls?

1 Like

This can easily be argued in the opposite direction (naive use of the RR). Baseline risk of death in non-diabetics was 0.4 and declined to 0.2 with treatment while, in diabetics, baseline risk of death was 0.8 and declined to 0.4 with treatment. The RR remains 0.5 in both groups because the RR declines as baseline risk increases and thus the RR of 0.5 in diabetics is overtly conservative and only numerically equivalent to that in non-diabetics. Given that proportions are bounded by 0 and 1, does this mean that a halving of mortality implies the same effect at any baseline risk? For example if an exposure doubles risk, at 40% baseline risk it increases risk to 80% but at 60% baseline risk it increases risk to what – 120%? The OR scale rectifies this problem with the RR and the effect of treatment in diabetics on the OR scale is 2.2 fold larger than in non-diabetics. The product term in a GLM with logit link was 0.44 (0.17/0.38) and suggests clearly the presence of effect modification by diabetes status. Thus, in the absence of diabetes (which itself increases the odds of death 6 fold on its own) the treatment decreases the odds of death 2.67 fold (1/0.375). In the presence of diabetes, the treatment decreases the odds of death 6 fold (1/0.1667). These OR’s are portable to any baseline risk.

On the flip side, I am not saying the two RR’s are incorrect. They are absolutely correct if we keep one simple point in mind – they only apply to the baseline risk for which they were computed. Thus the RR of 0.5 is correct for patients with a baseline risk of 0.4 without diabetes or baseline risk of 0.8 with diabetes. To see this, let us compute the expected RR from the OR of 0.375 without diabetes. Posterior odds = 0.4/0.6 × 0.375 = 0.25. Posterior risk = 0.25/1.25 = 0.2. The OR of 0.375 can be used with any baseline risk without diabetes e.g. with a risk of 0.8 the odds = 0.8/0.2 × 0.375 = 1.5 and posterior risk = 1.5/2.5 = 0.6. Had we applied the RR of 0.5 the posterior risk would have been 0.8 × 0.5 = 0.4 which is incorrect because the correct RR for a baseline risk of 0.8 without diabetes is 0.6/0.8 = 0.75.

The question for Shrier and Pang is what is their evidence that the RR of 0.5 is portable across baseline risk in the way they depict? The correct interpretation is that perhaps the RR is not a measure of effect and treating it as such is what led to this misreading of the common misinterpretation. If this is accepted then perhaps we should only assess effect modification on the OR scale and stop the discussion about additive versus multiplicative effect modification that persists in the literature (@R_cubed would appreciate your opinion on this). If this was a real trial, the only conclusion that can be drawn is that the treatment is twice as effective (on the OR scale of course) in diabetics as in non-diabetics and this should prompt a search for why, possibly unraveling useful mechanisms of interest to patient care.

5 Likes

This is a great discussion. I’d like to bring in one other consideration. When there are at least 3 predictors in the model, fit two models: (1) logit link with all 2-way interactions and (2) log link with all 2-way interactions. See which of the two models has the lower likelihood ratio \chi^2 statistic for the combined interaction terms. The model that needs the fewest interactions is more often than not the model that is set up to discover subject matter-relevant interactions and not just “keep the probabilities between 0 and 1” interactions.

3 Likes

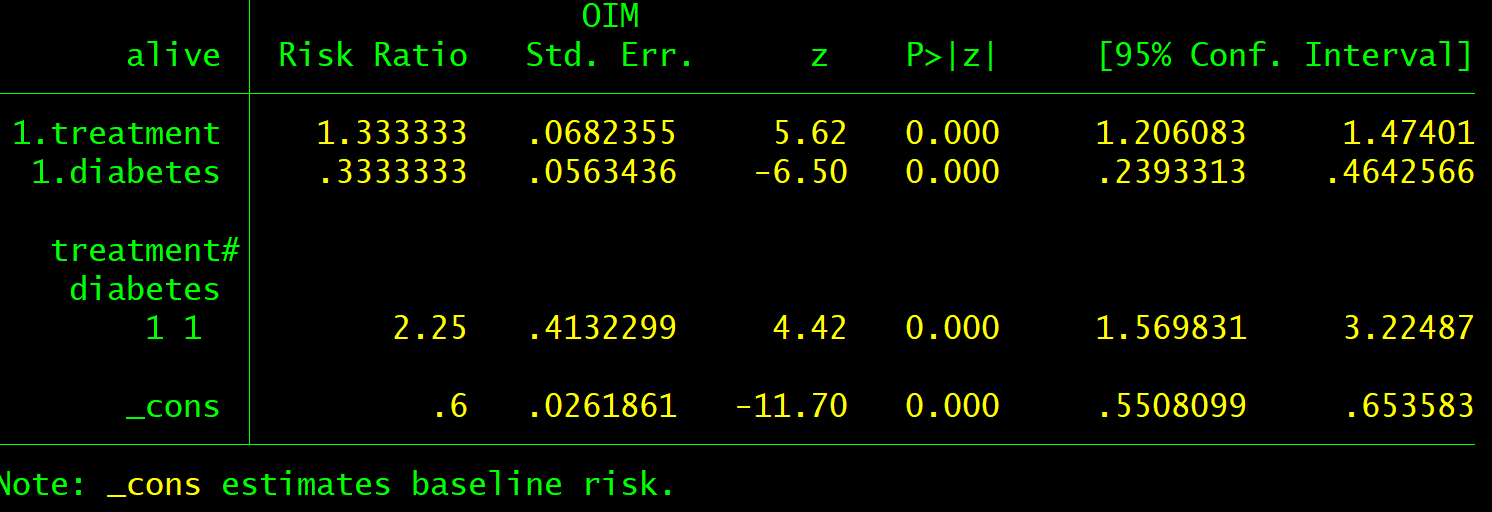
Well said. To illustrate this we just need to switch from RR(Y) to RR(not-Y) i.e. run a GLM with “alive” as the outcome instead of “dead”. This is what we get:

Now there is a product term that suggests effect modification on the RR scale only because of the variability in the “keep the probabilities between 0 and 1” interactions as circumstances change. On the OR scale this does not happen.

2 Likes

Everything I know about this issue comes from reading Dr. Stephen Senn, Dr. Harrell, or Dr. Sander Greenland. As far as I can tell, there is more agreement than disagreement among them, but I understand this might not be so obvious unless you go through a number of papers. It certainly wasn’t clear to me upon first reading a few of these.

Here are some papers (in my opinion) critical to understanding the points raised by Senn and Frank:
Lee, Y; Nelder, F (2004) Conditional and Marginal Models: Another View. Stat. Sci. 19(2) (link)

Blockquote
There has existed controversy about the use of marginal and conditional models, particularly in the analysis of data from longitudinal studies. We show that alleged differences in the behavior of parameters in so-called marginal and conditional models are based on a failure to compare like with like. In particular, these seemingly apparent differences are meaningless because they are mainly caused by preimposed unidentifiable constraints on the random effects in models. We discuss the advantages of conditional models over marginal models. We regard the conditional model as fundamental, from which marginal predictions can be made

Blockquote
When making patient decisions, one can easily (in most situations) convert the relative effect from the first step into an absolute risk reduction if one has an estimate of the current patient’s absolute risk. This estimate may come from the same trial that produced the relative efficacy estimate, if the RCT enrolled a sufficient variety of subjects. Or it can come from a purely observational study if that study contains a large number of subjects given usual care or some other appropriate reference set.

Sander Greenland (2004), Model-based Estimation of Relative Risks and Other Epidemiologic Measures in Studies of Common Outcomes and in Case-Control Studies, American Journal of Epidemiology, Volume 160, Issue 4, 15. Pages 301–305, https://doi.org/10.1093/aje/kwh221

Blockquote
Some recent articles have discussed biased methods for estimating risk ratios from adjusted odds ratios when the outcome is common, and the problem of setting confidence limits for risk ratios. These articles have overlooked the extensive literature on valid estimation of risks, risk ratios, and risk differences from logistic and other models, including methods that remain valid when the outcome is common, and methods for risk and rate estimation from case-control studies. The present article describes how most of these methods can be subsumed under a general formulation that also encompasses traditional standardization methods and methods for projecting the impact of partially successful interventions. Approximate variance formulas for the resulting estimates allow interval estimation; these intervals can be closely approximated by rapid simulation procedures that require only standard software functions.

Both epidemiologists and scientists performing clinical trials can use logistic regression to develop models to help clinicians and patients select the most relevant treatments. Do the statistics on the (additive) log odds scale, but convert baseline risks to the probability scale.

Someone please correct me if I’m mistaken here.
3 Likes

Section 2.1 of our review published today is related to this very interesting discussion from a clinical perspective and actually cites @s_doi’s paper along with other key influences including @Sander, @f2harrell and @Stephen while building on our interest in utility-based trial designs and modeling. Table 1 summarizes a reasonable framework.


.

3 Likes

Our critique of Doi et al.'s latest JCE commentary should be posted on medRxiv this week, after the mandatory screen. (If someone wants it right away, e-mail me and I’ll attach it.)

2 Likes

Essentially agrees with recommendations in our latest commentary and agree with this. I had a read of your paper and the example in appendix A with conditional OR of 2.67 and marginal OR of 2.25 makes sense since the marginal OR must be influenced by how prognostic status distributes across interventions and it seems odd to me (in all such scenarios) for a measure of effect to be collapsible.

1 Like

Yup, my sense is that everyone in this thread is in broad agreement. I expect though that we will learn something new from @Sander’s critique of your paper (and subsequent reply). Looking forward to that discussion!

Yup thanks, I was looking forward to the rebuttal too. Thanks to @Sander for sending me the pdf. I have had a first read and it is quite interesting but it does seem to me like the chicken-egg argument (on first read) that if there are situations where RR is constant across strata and OR is not (e.g. Shrier and Pang above) and vice-versa, then both must be non-portable or at least we are still at status quo. An additional observation is that simply stating that something is incorrect, wrong or absurd neither makes it incorrect, wrong nor absurd without empirical supporting evidence or reasons thereof.

I will take the points raised out of sequence in subsequent posts - and in this post focus on this argument:

“we nonetheless hypothesized that the magnitude of the correlation between the measure and baseline risks is similar in most cases. To evaluate our hypothesis, we summarized Spearman’s 𝜌 between RRs and baseline risks (𝜌𝑅𝑅) among 20,198 meta-analyses (each has 𝑛𝑛≥5 studies with binary outcomes), following a similar procedure to…”
“…In summary, among 20,198 meta-analyses in Cochrane Reviews, we found many similarities between the correlations of ORs versus RRs and baseline risks

We had evaluated the association between baseline risk and the two effect measures in 140,620 trials and showed no association between the OR and baseline risk and a very strong association between RR and baseline risk. This dataset is the same one the group is using in the rebuttal, so why would the group conduct correlations on the meta-analysis level as opposed to the study level, how was meta-analytic baseline risk defined (each study has a different baseline risk) and what utility do such correlations have in terms of interpretation in relation to their hypothesis?

1 Like