If one is doing Quality Improvement research, one might notice for example that patients are having infections in a hospital, and then one might change gloving/handwashing procedures and then remeasure infection rate. This is often assessed using a run chart, where one plots infection rate over time, examining the rate before and after the intervention.
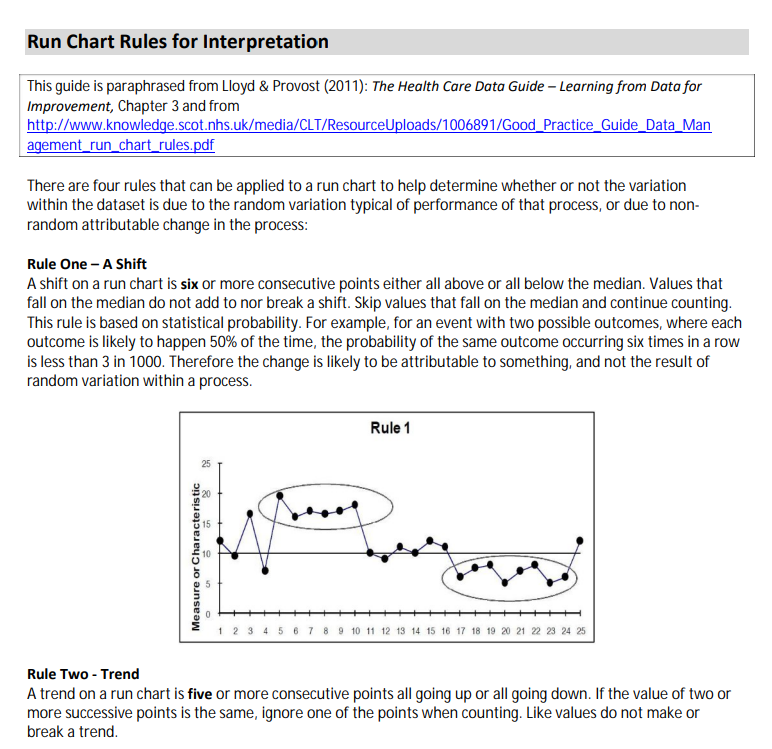
Some guidelines for run chart analysis are discussed in the linked document, and I attach a screenshot of a part of it. I was wondering if anyone had any thoughts on this.
To me, the “six points” rule seems arbitrary. The number of points should depend on the variance of the underlying data generating process, for example.
It might be the case that this particular method is outdated / not used. However, I was prompted to write this post by seeing the same rules appear in the Institute for Healthcare Improvement (IHI) basic certificate for patient care quality and safety.
3 Likes
In general, the heuristics used by the statistical process control engineers are reasonable if you are using materials developed by Donald Wheeler, W. Edwards Deming, or the grandfather of these methods – Walter Shewhart.
But my question: Is there an error in the text for rule one that describes a shift? If I did the math right, a binary event with a probability of 0.5 that occurs exactly 6 consecutive times is \frac{1}{2^6} = 0.015625, for 7, it is \frac{1}{2^{7}} = 0.0078125 neither of which I consider close enough to “less than 3 in 1000”.
A long time ago, I wrote a program to explore the relationship among various measures of information described in the link below; the numbers in the quoted text looked wrong to me. Is there a more charitable interpretation, or did the authors simply get the computations wrong?
 Related Threads
-
Thread with table relating powers of 2 with p values
Relating S-values to other measures of statistical information
-
A discussion of reasonable uses of p values as decision rules in Statistical Process Control
Frequentist vs Bayesian debate applied to real-world data analysis: any philosophical insights? - #11 by R_cubed
3 Likes
Not sure what’s going on in the text. I agree with your calculations.
Also, the 3/1000 has a sort of significance threshold feel to me, where I think instead the interpretation of the data should reflect the cost and benefit of the intervention.