OK. Thank you for your detailed explanation. Your objective is to estimate the interesting probability that a patient was on treatment or control conditional on an outcome. This is totally different to my objective and the purpose of my calculations, which is to predict an outcome conditional on disease severity with treatment or control. What I think of odds and likelihood ratios have to be transposed by you. You also regard all individuals in a trial as belonging to a single universal set to which you apply Bayes rule. You point out that this can lead to inconsistencies (e.g. when applying risk ratios). This is different to my approach of considering several universal sets, within which such inconsistencies cannot arise. I am interested in the relationships between these universal sets and the extent to which they can be modelled accurately using risk and odds ratios.
I regard randomisation as a process of creating two or more universal sets that represent counterfactual situations – the set of those treated and the set not treated or treated differently e.g. different dosages of a drug or placebo. Bayes rule is then applied within each universal set and comparisons are made between these universal sets in the form of risk ratios or odds ratios.
In order that risk ratios are collapsible between sets incorporating a degree of severity (and provide a coherent model), then the prior probability of the degree of severity must be the same in the control and treatment set and also the likelihood of the degree of severity conditional on the outcome must be the same in the control and treatment set.
In order that odds ratios are collapsible between sets incorporating a degree of severity (and provide a coherent model), then the likelihood of the degree of severity conditional on the outcome must be the same in the control and treatment set and also the likelihood of the degree of severity conditional on those without the outcome must be the same in the control and treatment set. This inevitably means that the prior probability of the degree of severity is different in the control and treatment set, suggesting interaction.
These conditions for risk ratio and odds ratio are rarely met precisely but often met approximately enough for the purposes of estimating probabilities for dichotomous variables (e.g. severe/not severe). They are also helpful in comparing clinical trials when there is variation in the baseline risk of an outcome in different trials. Risk ratios may work at very low outcome probabilities in RCTs but odds ratios appear to provide more consistent comparisons at low and high probabilities as would be expected theoretically. However, when it comes to modelling quantitative degrees of severity they may be too imprecise. This is the point that I was making in my post.
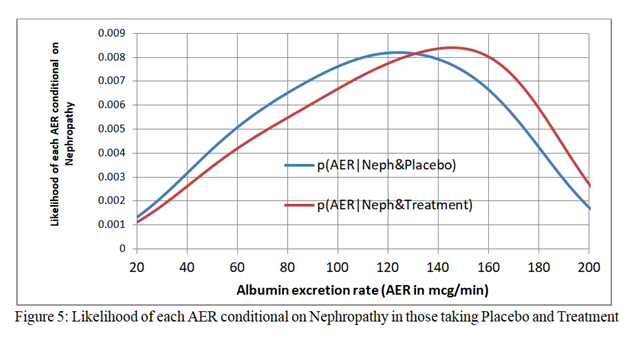
Figure 5 (just above) shows the distribution of albumin excretion rates in those with the outcome of nephropathy on treatment and placebo when logistic regression functions are fitted to the treatment and placebo data independently. They are not identical, which is a requirement for the odds ratio or risk ratio to be transportable over the full range of baseline risks due to disease severity. However, looking at the raw data after dichotomisation into those with an AER above 80mcg/min, the proportion with an AER over 80mcg/min in those with nephropathy on placebo was 20/30 = 0.67 and the proportion with an AER over 80mcg/min in those with nephropathy on treatment was 19/29 = 0.66. The proportion with an AER over 80mcg/min in those WITHOUT nephropathy on placebo was 42/166 = 0.25. The proportion with an AER over 80mcg/min in those WITHOUT nephropathy on treatment was 93/346 = 0.27.
Based on dichotomizing the data into those above and not above an AER of 80mcg/min, the closeness of 0.67 and 0.66 and 0.25 and 0.27 in the presence of stochastic variation in the observed proportions satisfies the criterion for the odds ratio being transportable from the placebo set to the treatment set. Furthermore the proportion with an AER over 80mcg/min in the placebo limb was 62/196 = 0.316 and the proportion with an AER over 80mcg/in in the treatment limb was identical at 112/355 = 0.315 (which is what one would expect after randomisation) suggesting that the risk ratio was also transportable from the placebo set to the treatment set.
The observed proportion with nephropathy in those with an AER over 80mcg/min in those on treatment was 19/111 = 0.171. If we were to assume transportable risk ratio from the placebo set to the treatment set it would be calculated as (20/62)(29/375)/(30/196) = 0.163 (an under-estimate for 0.171). If we were to assume a transportable odds ratio it would be ((20/62)/(1-20/62))(29/375)/(1-29/375)/((30/196)/(1-30/196))/(1+((20/62)/(1-20/62))(29/375)/(1-29/375)/((30/196)/(1-30/196)) = 0.181 (an over-estimate for 0.171).
This means that for this particular data set, both the risk ratio and odds ratio provide reasonable estimates of the probabilities of an outcome on treatment if we know the probability of the outcome on placebo when we deal with dichotomised AER of above and not above 80mcg/min. However, as shown in Figure 2 of my first post they are not transportable for a range of AER values representing degrees of disease severity.
